Immigrants from Trinidad and Tobago vs Immigrants from Guyana Female Poverty
COMPARE
Immigrants from Trinidad and Tobago
Immigrants from Guyana
Female Poverty
Female Poverty Comparison
Immigrants from Trinidad and Tobago
Immigrants from Guyana
15.4%
FEMALE POVERTY
0.3/ 100
METRIC RATING
251st/ 347
METRIC RANK
15.6%
FEMALE POVERTY
0.1/ 100
METRIC RATING
260th/ 347
METRIC RANK
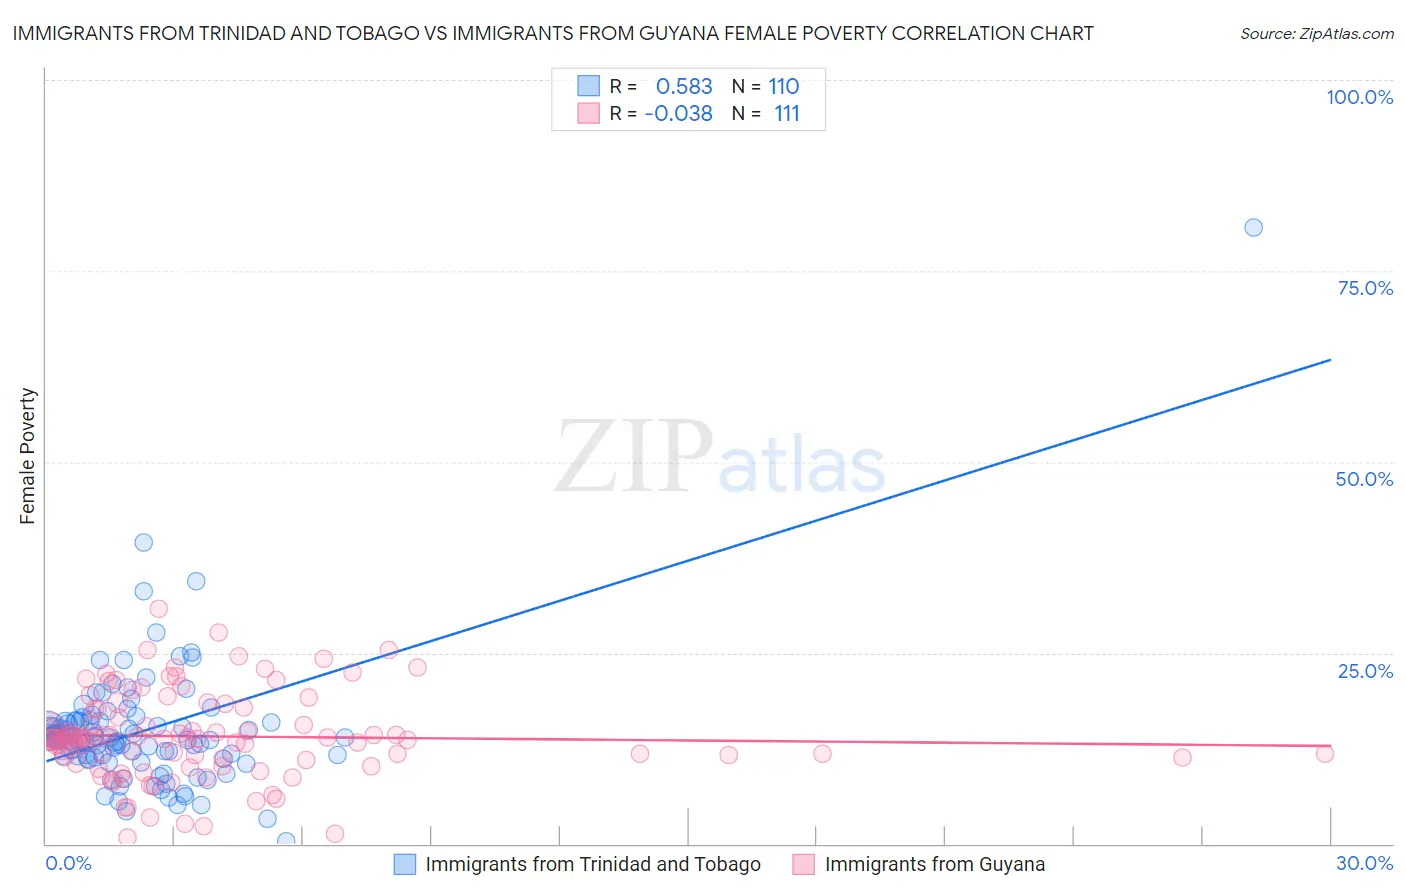
Immigrants from Trinidad and Tobago vs Immigrants from Guyana Female Poverty Correlation Chart
The statistical analysis conducted on geographies consisting of 223,462,695 people shows a substantial positive correlation between the proportion of Immigrants from Trinidad and Tobago and poverty level among females in the United States with a correlation coefficient (R) of 0.583 and weighted average of 15.4%. Similarly, the statistical analysis conducted on geographies consisting of 183,633,406 people shows no correlation between the proportion of Immigrants from Guyana and poverty level among females in the United States with a correlation coefficient (R) of -0.038 and weighted average of 15.6%, a difference of 1.5%.
Female Poverty Correlation Summary
| Measurement | Immigrants from Trinidad and Tobago | Immigrants from Guyana |
| Minimum | 0.35% | 0.82% |
| Maximum | 80.6% | 30.8% |
| Range | 80.3% | 30.0% |
| Mean | 14.7% | 14.1% |
| Median | 13.7% | 13.7% |
| Interquartile 25% (IQ1) | 11.4% | 10.9% |
| Interquartile 75% (IQ3) | 16.1% | 17.7% |
| Interquartile Range (IQR) | 4.7% | 6.8% |
| Standard Deviation (Sample) | 8.7% | 5.7% |
| Standard Deviation (Population) | 8.7% | 5.7% |
Demographics Similar to Immigrants from Trinidad and Tobago and Immigrants from Guyana by Female Poverty
In terms of female poverty, the demographic groups most similar to Immigrants from Trinidad and Tobago are Immigrants from Burma/Myanmar (15.4%, a difference of 0.030%), Immigrants from Western Africa (15.3%, a difference of 0.16%), Salvadoran (15.3%, a difference of 0.20%), Liberian (15.4%, a difference of 0.30%), and Immigrants from Ghana (15.3%, a difference of 0.34%). Similarly, the demographic groups most similar to Immigrants from Guyana are Cape Verdean (15.6%, a difference of 0.080%), Guyanese (15.6%, a difference of 0.10%), Mexican American Indian (15.6%, a difference of 0.10%), Cherokee (15.6%, a difference of 0.11%), and Shoshone (15.6%, a difference of 0.19%).
| Demographics | Rating | Rank | Female Poverty |
| Spanish American Indians | 0.3 /100 | #245 | Tragic 15.3% |
| Cubans | 0.3 /100 | #246 | Tragic 15.3% |
| Potawatomi | 0.3 /100 | #247 | Tragic 15.3% |
| Immigrants | Ghana | 0.3 /100 | #248 | Tragic 15.3% |
| Salvadorans | 0.3 /100 | #249 | Tragic 15.3% |
| Immigrants | Western Africa | 0.3 /100 | #250 | Tragic 15.3% |
| Immigrants | Trinidad and Tobago | 0.3 /100 | #251 | Tragic 15.4% |
| Immigrants | Burma/Myanmar | 0.3 /100 | #252 | Tragic 15.4% |
| Liberians | 0.2 /100 | #253 | Tragic 15.4% |
| Trinidadians and Tobagonians | 0.2 /100 | #254 | Tragic 15.4% |
| Ottawa | 0.2 /100 | #255 | Tragic 15.5% |
| Jamaicans | 0.2 /100 | #256 | Tragic 15.5% |
| Immigrants | Jamaica | 0.1 /100 | #257 | Tragic 15.6% |
| Shoshone | 0.1 /100 | #258 | Tragic 15.6% |
| Cape Verdeans | 0.1 /100 | #259 | Tragic 15.6% |
| Immigrants | Guyana | 0.1 /100 | #260 | Tragic 15.6% |
| Guyanese | 0.1 /100 | #261 | Tragic 15.6% |
| Mexican American Indians | 0.1 /100 | #262 | Tragic 15.6% |
| Cherokee | 0.1 /100 | #263 | Tragic 15.6% |
| Immigrants | Ecuador | 0.1 /100 | #264 | Tragic 15.6% |
| Immigrants | Liberia | 0.1 /100 | #265 | Tragic 15.7% |