Welsh vs Immigrants from Austria Female Poverty
COMPARE
Welsh
Immigrants from Austria
Female Poverty
Female Poverty Comparison
Welsh
Immigrants from Austria
12.7%
FEMALE POVERTY
91.6/ 100
METRIC RATING
114th/ 347
METRIC RANK
12.0%
FEMALE POVERTY
98.7/ 100
METRIC RATING
53rd/ 347
METRIC RANK
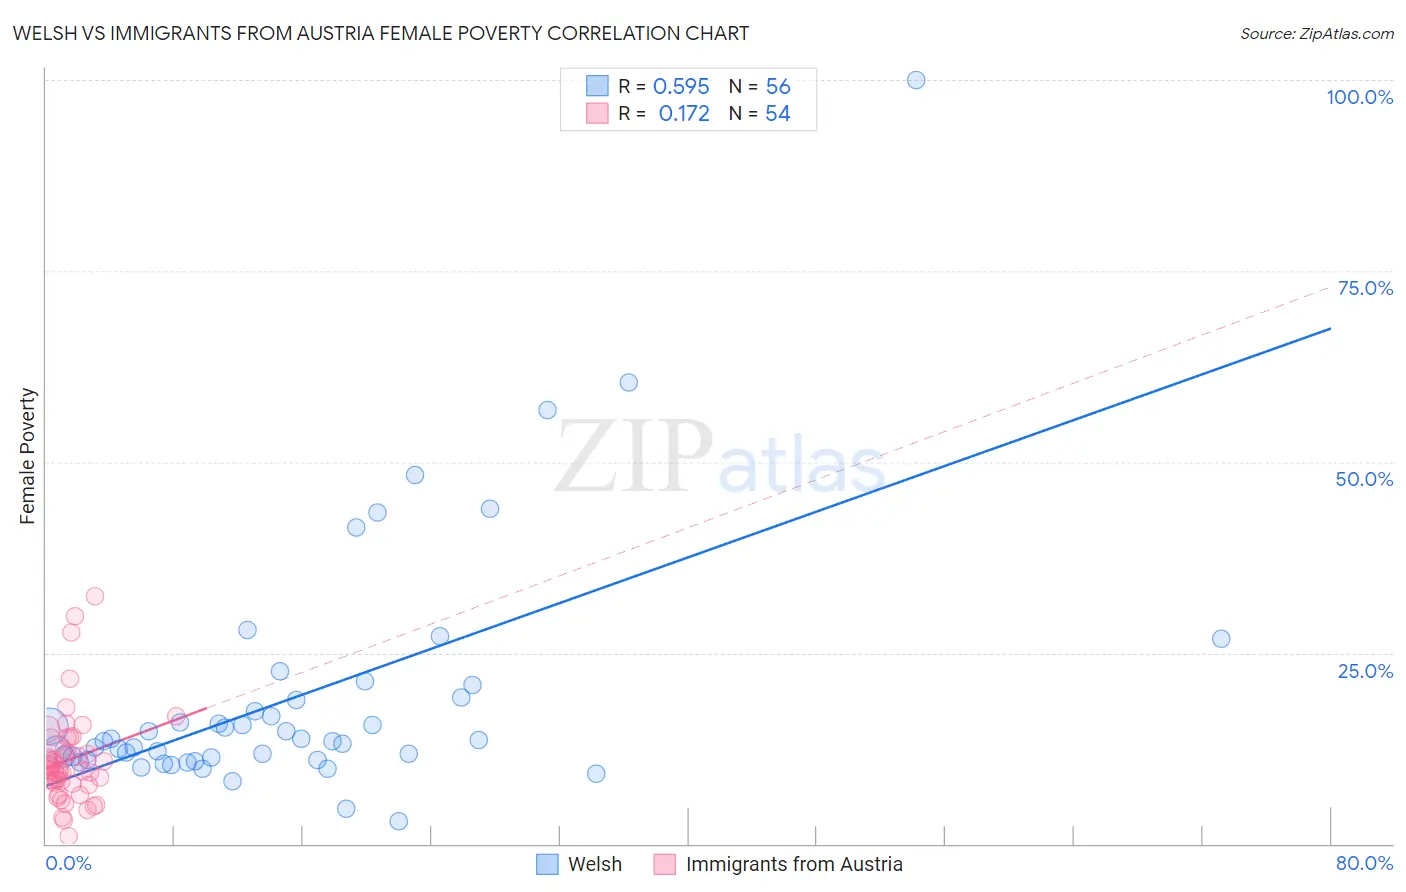
Welsh vs Immigrants from Austria Female Poverty Correlation Chart
The statistical analysis conducted on geographies consisting of 527,858,131 people shows a substantial positive correlation between the proportion of Welsh and poverty level among females in the United States with a correlation coefficient (R) of 0.595 and weighted average of 12.7%. Similarly, the statistical analysis conducted on geographies consisting of 167,923,164 people shows a poor positive correlation between the proportion of Immigrants from Austria and poverty level among females in the United States with a correlation coefficient (R) of 0.172 and weighted average of 12.0%, a difference of 5.3%.
Female Poverty Correlation Summary
| Measurement | Welsh | Immigrants from Austria |
| Minimum | 3.0% | 0.92% |
| Maximum | 100.0% | 32.5% |
| Range | 97.0% | 31.6% |
| Mean | 19.2% | 11.0% |
| Median | 13.5% | 9.6% |
| Interquartile 25% (IQ1) | 11.1% | 8.0% |
| Interquartile 75% (IQ3) | 19.0% | 12.2% |
| Interquartile Range (IQR) | 7.9% | 4.2% |
| Standard Deviation (Sample) | 16.4% | 6.0% |
| Standard Deviation (Population) | 16.2% | 6.0% |
Similar Demographics by Female Poverty
Demographics Similar to Welsh by Female Poverty
In terms of female poverty, the demographic groups most similar to Welsh are Puget Sound Salish (12.7%, a difference of 0.020%), Canadian (12.7%, a difference of 0.12%), Immigrants from Russia (12.7%, a difference of 0.14%), Immigrants from Israel (12.6%, a difference of 0.15%), and Immigrants from Southern Europe (12.7%, a difference of 0.22%).
| Demographics | Rating | Rank | Female Poverty |
| Laotians | 93.4 /100 | #107 | Exceptional 12.6% |
| Portuguese | 93.1 /100 | #108 | Exceptional 12.6% |
| Immigrants | Zimbabwe | 93.1 /100 | #109 | Exceptional 12.6% |
| Paraguayans | 93.0 /100 | #110 | Exceptional 12.6% |
| Soviet Union | 92.4 /100 | #111 | Exceptional 12.6% |
| Immigrants | Israel | 92.0 /100 | #112 | Exceptional 12.6% |
| Canadians | 92.0 /100 | #113 | Exceptional 12.7% |
| Welsh | 91.6 /100 | #114 | Exceptional 12.7% |
| Puget Sound Salish | 91.5 /100 | #115 | Exceptional 12.7% |
| Immigrants | Russia | 91.2 /100 | #116 | Exceptional 12.7% |
| Immigrants | Southern Europe | 90.9 /100 | #117 | Exceptional 12.7% |
| Sri Lankans | 90.9 /100 | #118 | Exceptional 12.7% |
| Albanians | 90.8 /100 | #119 | Exceptional 12.7% |
| New Zealanders | 90.6 /100 | #120 | Exceptional 12.7% |
| Immigrants | Hungary | 90.3 /100 | #121 | Exceptional 12.7% |
Demographics Similar to Immigrants from Austria by Female Poverty
In terms of female poverty, the demographic groups most similar to Immigrants from Austria are Immigrants from Croatia (12.0%, a difference of 0.010%), Immigrants from Philippines (12.1%, a difference of 0.14%), Immigrants from Bulgaria (12.0%, a difference of 0.31%), Immigrants from Sri Lanka (12.1%, a difference of 0.50%), and Slovene (12.0%, a difference of 0.53%).
| Demographics | Rating | Rank | Female Poverty |
| Turks | 99.2 /100 | #46 | Exceptional 11.9% |
| Asians | 99.1 /100 | #47 | Exceptional 11.9% |
| Immigrants | Japan | 99.0 /100 | #48 | Exceptional 11.9% |
| Immigrants | Romania | 99.0 /100 | #49 | Exceptional 12.0% |
| Slovenes | 98.9 /100 | #50 | Exceptional 12.0% |
| Immigrants | Bulgaria | 98.9 /100 | #51 | Exceptional 12.0% |
| Immigrants | Croatia | 98.7 /100 | #52 | Exceptional 12.0% |
| Immigrants | Austria | 98.7 /100 | #53 | Exceptional 12.0% |
| Immigrants | Philippines | 98.7 /100 | #54 | Exceptional 12.1% |
| Immigrants | Sri Lanka | 98.5 /100 | #55 | Exceptional 12.1% |
| Estonians | 98.3 /100 | #56 | Exceptional 12.1% |
| Immigrants | Serbia | 98.3 /100 | #57 | Exceptional 12.1% |
| Scandinavians | 98.2 /100 | #58 | Exceptional 12.1% |
| Immigrants | Europe | 98.2 /100 | #59 | Exceptional 12.1% |
| Immigrants | Australia | 98.1 /100 | #60 | Exceptional 12.2% |