Welsh vs Immigrants from Guyana Bachelor's Degree
COMPARE
Welsh
Immigrants from Guyana
Bachelor's Degree
Bachelor's Degree Comparison
Welsh
Immigrants from Guyana
37.0%
BACHELOR'S DEGREE
29.1/ 100
METRIC RATING
198th/ 347
METRIC RANK
33.9%
BACHELOR'S DEGREE
1.4/ 100
METRIC RATING
243rd/ 347
METRIC RANK
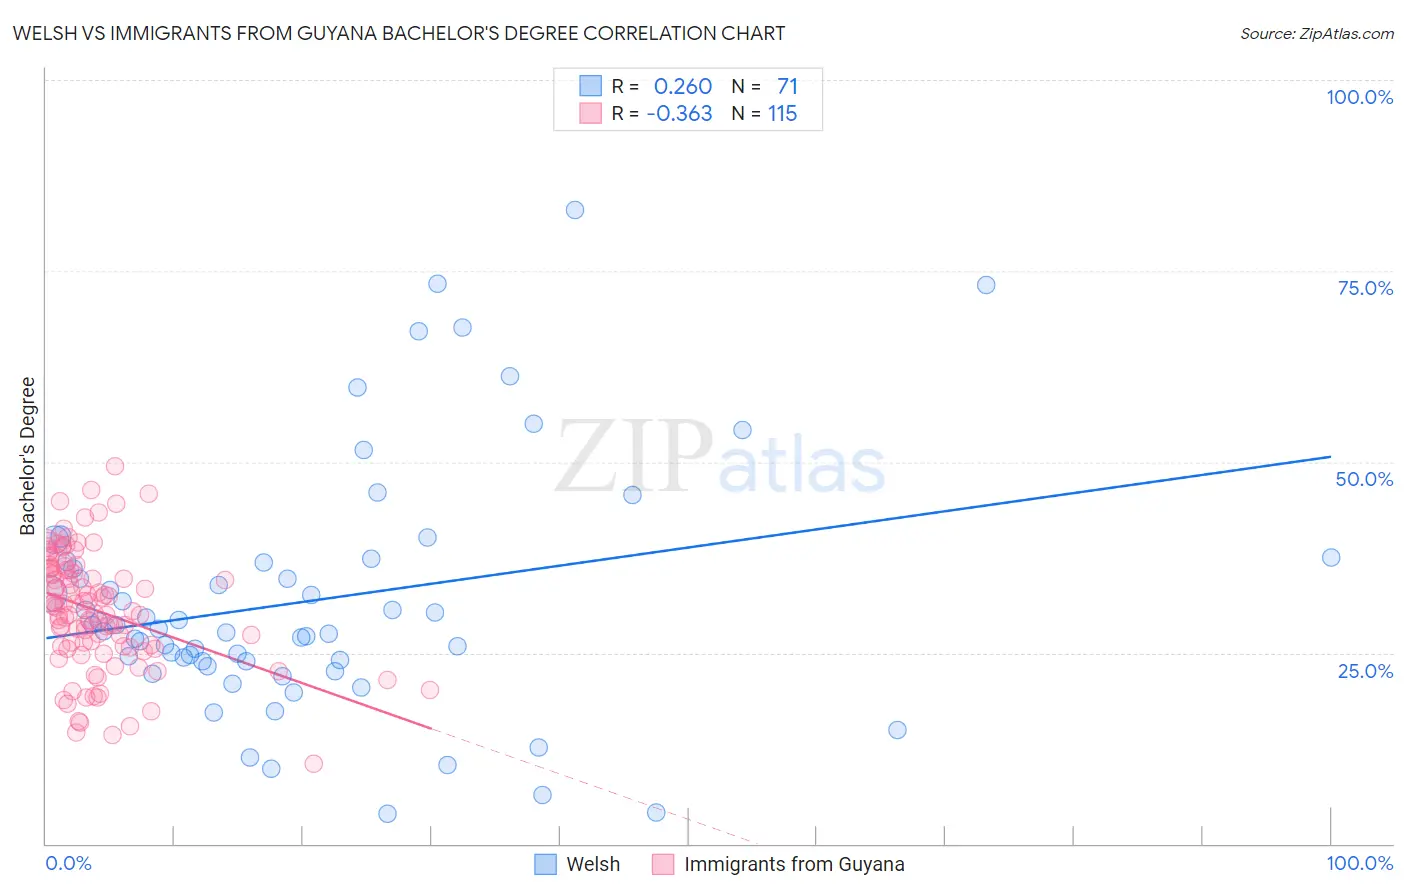
Welsh vs Immigrants from Guyana Bachelor's Degree Correlation Chart
The statistical analysis conducted on geographies consisting of 528,521,285 people shows a weak positive correlation between the proportion of Welsh and percentage of population with at least bachelor's degree education in the United States with a correlation coefficient (R) of 0.260 and weighted average of 37.0%. Similarly, the statistical analysis conducted on geographies consisting of 183,738,689 people shows a mild negative correlation between the proportion of Immigrants from Guyana and percentage of population with at least bachelor's degree education in the United States with a correlation coefficient (R) of -0.363 and weighted average of 33.9%, a difference of 9.0%.
Bachelor's Degree Correlation Summary
| Measurement | Welsh | Immigrants from Guyana |
| Minimum | 3.9% | 10.5% |
| Maximum | 83.0% | 49.4% |
| Range | 79.1% | 38.9% |
| Mean | 31.9% | 30.5% |
| Median | 28.2% | 31.0% |
| Interquartile 25% (IQ1) | 23.9% | 25.6% |
| Interquartile 75% (IQ3) | 36.9% | 36.0% |
| Interquartile Range (IQR) | 13.0% | 10.3% |
| Standard Deviation (Sample) | 16.3% | 7.7% |
| Standard Deviation (Population) | 16.2% | 7.7% |
Similar Demographics by Bachelor's Degree
Demographics Similar to Welsh by Bachelor's Degree
In terms of bachelor's degree, the demographic groups most similar to Welsh are Czechoslovakian (37.0%, a difference of 0.010%), Celtic (37.0%, a difference of 0.050%), Korean (37.0%, a difference of 0.080%), Belgian (37.0%, a difference of 0.10%), and Immigrants from Costa Rica (36.9%, a difference of 0.21%).
| Demographics | Rating | Rank | Bachelor's Degree |
| Nigerians | 33.9 /100 | #191 | Fair 37.2% |
| Immigrants | Vietnam | 32.1 /100 | #192 | Fair 37.1% |
| Yugoslavians | 31.5 /100 | #193 | Fair 37.1% |
| Belgians | 29.9 /100 | #194 | Fair 37.0% |
| Koreans | 29.8 /100 | #195 | Fair 37.0% |
| Celtics | 29.5 /100 | #196 | Fair 37.0% |
| Czechoslovakians | 29.2 /100 | #197 | Fair 37.0% |
| Welsh | 29.1 /100 | #198 | Fair 37.0% |
| Immigrants | Costa Rica | 27.4 /100 | #199 | Fair 36.9% |
| Immigrants | Ghana | 27.4 /100 | #200 | Fair 36.9% |
| Immigrants | South Eastern Asia | 25.4 /100 | #201 | Fair 36.8% |
| Immigrants | Zaire | 25.3 /100 | #202 | Fair 36.8% |
| Immigrants | Nigeria | 23.1 /100 | #203 | Fair 36.7% |
| Immigrants | Immigrants | 22.8 /100 | #204 | Fair 36.7% |
| Finns | 22.2 /100 | #205 | Fair 36.7% |
Demographics Similar to Immigrants from Guyana by Bachelor's Degree
In terms of bachelor's degree, the demographic groups most similar to Immigrants from Guyana are Delaware (33.8%, a difference of 0.50%), Immigrants from Fiji (33.7%, a difference of 0.59%), Nonimmigrants (34.2%, a difference of 0.64%), Immigrants from Cambodia (34.2%, a difference of 0.71%), and Jamaican (33.6%, a difference of 0.96%).
| Demographics | Rating | Rank | Bachelor's Degree |
| Liberians | 2.8 /100 | #236 | Tragic 34.6% |
| Tlingit-Haida | 2.8 /100 | #237 | Tragic 34.6% |
| Guyanese | 2.5 /100 | #238 | Tragic 34.5% |
| British West Indians | 2.5 /100 | #239 | Tragic 34.5% |
| Tongans | 2.0 /100 | #240 | Tragic 34.3% |
| Immigrants | Cambodia | 1.9 /100 | #241 | Tragic 34.2% |
| Immigrants | Nonimmigrants | 1.8 /100 | #242 | Tragic 34.2% |
| Immigrants | Guyana | 1.4 /100 | #243 | Tragic 33.9% |
| Delaware | 1.2 /100 | #244 | Tragic 33.8% |
| Immigrants | Fiji | 1.2 /100 | #245 | Tragic 33.7% |
| Jamaicans | 1.0 /100 | #246 | Tragic 33.6% |
| Immigrants | Congo | 1.0 /100 | #247 | Tragic 33.6% |
| Cree | 1.0 /100 | #248 | Tragic 33.6% |
| Immigrants | Liberia | 0.9 /100 | #249 | Tragic 33.5% |
| Indonesians | 0.9 /100 | #250 | Tragic 33.5% |