Welsh vs Immigrants from Australia Female Poverty

COMPARE

Welsh
Race
Ancestry
AfghanAfricanAlaska NativeAlaskan AthabascanAlbanianAleutAlsatianAmericanApacheArabArapahoArgentineanArmenianAssyrian/Chaldean/SyriacAustralianAustrianBahamianBangladeshiBarbadianBasqueBelgianBelizeanBermudanBhutaneseBlackfeetBolivianBrazilianBritishBritish West IndianBulgarianBurmeseCajunCambodianCanadianCape VerdeanCarpatho RusynCelticCentral AmericanCentral American IndianCherokeeCheyenneChickasawChileanChineseChippewaChoctawColombianColvilleComancheCosta RicanCreeCreekCroatianCrowCubanCypriotCzechCzechoslovakianDanishDelawareDominicanDutchDutch West IndianEastern EuropeanEcuadorianEgyptianEnglishEstonianEthiopianEuropeanFijianFilipinoFinnishFrenchFrench American IndianFrench CanadianGermanGerman RussianGhanaianGreekGuamanian/ChamorroGuatemalanGuyaneseHaitianHmongHonduranHopiHoumaHungarianIcelanderIndian (Asian)IndonesianInupiatIranianIraqiIrishIroquoisIsraeliItalianJamaicanJapaneseJordanianKenyanKiowaKoreanLaotianLatvianLebaneseLiberianLithuanianLumbeeLuxembourgerMacedonianMalaysianMalteseMarshalleseMenomineeMexicanMexican American IndianMongolianMoroccanNative HawaiianNavajoNepaleseNew ZealanderNicaraguanNigerianNorthern EuropeanNorwegianOkinawanOsageOttawaPaiutePakistaniPalestinianPanamanianParaguayanPennsylvania GermanPeruvianPimaPolishPortuguesePotawatomiPuebloPuerto RicanPuget Sound SalishRomanianRussianSalvadoranSamoanScandinavianScotch-IrishScottishSeminoleSenegaleseSerbianShoshoneSierra LeoneanSiouxSlavicSlovakSloveneSomaliSouth AfricanSouth AmericanSouth American IndianSoviet UnionSpaniardSpanishSpanish AmericanSpanish American IndianSri LankanSubsaharan AfricanSudaneseSwedishSwissSyrianTaiwaneseThaiTlingit-HaidaTohono O'OdhamTonganTrinidadian and TobagonianTsimshianTurkishU.S. Virgin IslanderUgandanUkrainianUruguayanUteVenezuelanVietnameseWelshWest IndianYakamaYaquiYugoslavianYumanYup'ikZimbabwean
Immigration
NonimmigrantsImmigrantsAfghanistanAfricaAlbaniaArgentinaArmeniaAsiaAustriaBahamasBangladeshBarbadosBelarusBelgiumBelizeBoliviaBosnia and HerzegovinaBrazilBulgariaBurma/MyanmarCabo VerdeCambodiaCameroonCanadaCaribbeanCentral AmericaChileChinaColombiaCongoCosta RicaCroatiaCubaCzechoslovakiaDenmarkDominicaDominican RepublicEastern AfricaEastern AsiaEastern EuropeEcuadorEgyptEl SalvadorEnglandEritreaEthiopiaEuropeFijiFranceGermanyGhanaGreeceGrenadaGuatemalaGuyanaHaitiHondurasHong KongHungaryIndiaIndonesiaIranIraqIrelandIsraelItalyJamaicaJapanJordanKazakhstanKenyaKoreaKuwaitLaosLatin AmericaLatviaLebanonLiberiaLithuaniaMalaysiaMexicoMicronesiaMiddle AfricaMoldovaMoroccoNepalNetherlandsNicaraguaNigeriaNorth AmericaNorth MacedoniaNorthern AfricaNorthern EuropeNorwayOceaniaPakistanPanamaPeruPhilippinesPolandPortugalRomaniaRussiaSaudi ArabiaScotlandSenegalSerbiaSierra LeoneSingaporeSomaliaSouth AfricaSouth AmericaSouth Central AsiaSouth Eastern AsiaSouthern EuropeSpainSri LankaSt. Vincent and the GrenadinesSudanSwedenSwitzerlandSyriaTaiwanThailandTrinidad and TobagoTurkeyUgandaUkraineUruguayUzbekistanVenezuelaVietnamWest IndiesWestern AfricaWestern AsiaWestern EuropeYemenZaireZimbabweAzores
Immigrants from Australia
Race
Ancestry
AfghanAfricanAlaska NativeAlaskan AthabascanAlbanianAleutAlsatianAmericanApacheArabArapahoArgentineanArmenianAssyrian/Chaldean/SyriacAustralianAustrianBahamianBangladeshiBarbadianBasqueBelgianBelizeanBermudanBhutaneseBlackfeetBolivianBrazilianBritishBritish West IndianBulgarianBurmeseCajunCambodianCanadianCape VerdeanCarpatho RusynCelticCentral AmericanCentral American IndianCherokeeCheyenneChickasawChileanChineseChippewaChoctawColombianColvilleComancheCosta RicanCreeCreekCroatianCrowCubanCypriotCzechCzechoslovakianDanishDelawareDominicanDutchDutch West IndianEastern EuropeanEcuadorianEgyptianEnglishEstonianEthiopianEuropeanFijianFilipinoFinnishFrenchFrench American IndianFrench CanadianGermanGerman RussianGhanaianGreekGuamanian/ChamorroGuatemalanGuyaneseHaitianHmongHonduranHopiHoumaHungarianIcelanderIndian (Asian)IndonesianInupiatIranianIraqiIrishIroquoisIsraeliItalianJamaicanJapaneseJordanianKenyanKiowaKoreanLaotianLatvianLebaneseLiberianLithuanianLumbeeLuxembourgerMacedonianMalaysianMalteseMarshalleseMenomineeMexicanMexican American IndianMongolianMoroccanNative HawaiianNavajoNepaleseNew ZealanderNicaraguanNigerianNorthern EuropeanNorwegianOkinawanOsageOttawaPaiutePakistaniPalestinianPanamanianParaguayanPennsylvania GermanPeruvianPimaPolishPortuguesePotawatomiPuebloPuerto RicanPuget Sound SalishRomanianRussianSalvadoranSamoanScandinavianScotch-IrishScottishSeminoleSenegaleseSerbianShoshoneSierra LeoneanSiouxSlavicSlovakSloveneSomaliSouth AfricanSouth AmericanSouth American IndianSoviet UnionSpaniardSpanishSpanish AmericanSpanish American IndianSri LankanSubsaharan AfricanSudaneseSwedishSwissSyrianTaiwaneseThaiTlingit-HaidaTohono O'OdhamTonganTrinidadian and TobagonianTsimshianTurkishU.S. Virgin IslanderUgandanUkrainianUruguayanUteVenezuelanVietnameseWest IndianYakamaYaquiYugoslavianYumanYup'ikZimbabwean
Immigration
NonimmigrantsImmigrantsAfghanistanAfricaAlbaniaArgentinaArmeniaAsiaAustraliaAustriaBahamasBangladeshBarbadosBelarusBelgiumBelizeBoliviaBosnia and HerzegovinaBrazilBulgariaBurma/MyanmarCabo VerdeCambodiaCameroonCanadaCaribbeanCentral AmericaChileChinaColombiaCongoCosta RicaCroatiaCubaCzechoslovakiaDenmarkDominicaDominican RepublicEastern AfricaEastern AsiaEastern EuropeEcuadorEgyptEl SalvadorEnglandEritreaEthiopiaEuropeFijiFranceGermanyGhanaGreeceGrenadaGuatemalaGuyanaHaitiHondurasHong KongHungaryIndiaIndonesiaIranIraqIrelandIsraelItalyJamaicaJapanJordanKazakhstanKenyaKoreaKuwaitLaosLatin AmericaLatviaLebanonLiberiaLithuaniaMalaysiaMexicoMicronesiaMiddle AfricaMoldovaMoroccoNepalNetherlandsNicaraguaNigeriaNorth AmericaNorth MacedoniaNorthern AfricaNorthern EuropeNorwayOceaniaPakistanPanamaPeruPhilippinesPolandPortugalRomaniaRussiaSaudi ArabiaScotlandSenegalSerbiaSierra LeoneSingaporeSomaliaSouth AfricaSouth AmericaSouth Central AsiaSouth Eastern AsiaSouthern EuropeSpainSri LankaSt. Vincent and the GrenadinesSudanSwedenSwitzerlandSyriaTaiwanThailandTrinidad and TobagoTurkeyUgandaUkraineUruguayUzbekistanVenezuelaVietnamWest IndiesWestern AfricaWestern AsiaWestern EuropeYemenZaireZimbabweAzores
Female Poverty
Income
Poverty
Unemployment
Labor Participation
Family Structure
Vehicle Availability
Education Level
Disability

Female Poverty Comparison

Welsh

Immigrants from Australia

Exceptional
Exceptional
12.7%
FEMALE POVERTY
91.6/ 100
METRIC RATING
114th/ 347
METRIC RANK
12.2%
FEMALE POVERTY
98.1/ 100
METRIC RATING
60th/ 347
METRIC RANK

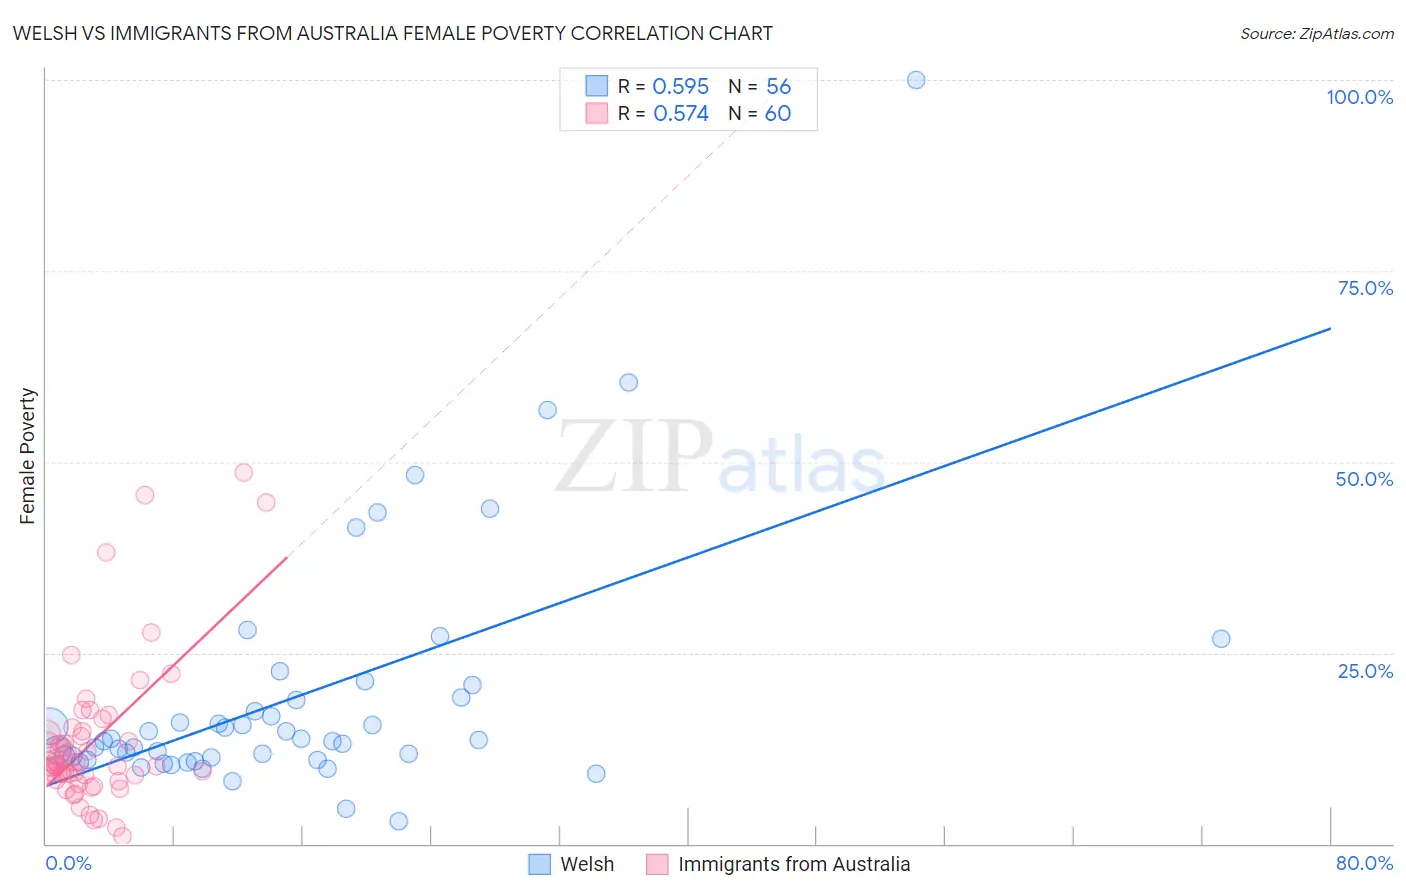
Welsh vs Immigrants from Australia Female Poverty Correlation Chart

The statistical analysis conducted on geographies consisting of 527,858,131 people shows a substantial positive correlation between the proportion of Welsh and poverty level among females in the United States with a correlation coefficient (R) of 0.595 and weighted average of 12.7%. Similarly, the statistical analysis conducted on geographies consisting of 227,116,794 people shows a substantial positive correlation between the proportion of Immigrants from Australia and poverty level among females in the United States with a correlation coefficient (R) of 0.574 and weighted average of 12.2%, a difference of 4.1%.
Welsh vs Immigrants from Australia Female Poverty

Female Poverty Correlation Summary

MeasurementWelshImmigrants from Australia
Minimum3.0%0.92%
Maximum100.0%48.6%
Range97.0%47.6%
Mean19.2%13.4%
Median13.5%10.3%
Interquartile 25% (IQ1)11.1%8.7%
Interquartile 75% (IQ3)19.0%14.6%
Interquartile Range (IQR)7.9%5.9%
Standard Deviation (Sample)16.4%9.8%
Standard Deviation (Population)16.2%9.7%

Similar Demographics by Female Poverty

Demographics Similar to Welsh by Female Poverty

In terms of female poverty, the demographic groups most similar to Welsh are Puget Sound Salish (12.7%, a difference of 0.020%), Canadian (12.7%, a difference of 0.12%), Immigrants from Russia (12.7%, a difference of 0.14%), Immigrants from Israel (12.6%, a difference of 0.15%), and Immigrants from Southern Europe (12.7%, a difference of 0.22%).
DemographicsRating | RankFemale Poverty
Laotians
93.4
/100
|
#107
Exceptional
12.6%
Portuguese
93.1
/100
|
#108
Exceptional
12.6%
Immigrants | Zimbabwe
93.1
/100
|
#109
Exceptional
12.6%
Paraguayans
93.0
/100
|
#110
Exceptional
12.6%
Soviet Union
92.4
/100
|
#111
Exceptional
12.6%
Immigrants | Israel
92.0
/100
|
#112
Exceptional
12.6%
Canadians
92.0
/100
|
#113
Exceptional
12.7%
Welsh
91.6
/100
|
#114
Exceptional
12.7%
Puget Sound Salish
91.5
/100
|
#115
Exceptional
12.7%
Immigrants | Russia
91.2
/100
|
#116
Exceptional
12.7%
Immigrants | Southern Europe
90.9
/100
|
#117
Exceptional
12.7%
Sri Lankans
90.9
/100
|
#118
Exceptional
12.7%
Albanians
90.8
/100
|
#119
Exceptional
12.7%
New Zealanders
90.6
/100
|
#120
Exceptional
12.7%
Immigrants | Hungary
90.3
/100
|
#121
Exceptional
12.7%

Demographics Similar to Immigrants from Australia by Female Poverty

In terms of female poverty, the demographic groups most similar to Immigrants from Australia are Immigrants from Asia (12.2%, a difference of 0.0%), Immigrants from Italy (12.2%, a difference of 0.030%), Ukrainian (12.2%, a difference of 0.11%), German (12.2%, a difference of 0.14%), and Indian (Asian) (12.2%, a difference of 0.17%).
DemographicsRating | RankFemale Poverty
Immigrants | Austria
98.7
/100
|
#53
Exceptional
12.0%
Immigrants | Philippines
98.7
/100
|
#54
Exceptional
12.1%
Immigrants | Sri Lanka
98.5
/100
|
#55
Exceptional
12.1%
Estonians
98.3
/100
|
#56
Exceptional
12.1%
Immigrants | Serbia
98.3
/100
|
#57
Exceptional
12.1%
Scandinavians
98.2
/100
|
#58
Exceptional
12.1%
Immigrants | Europe
98.2
/100
|
#59
Exceptional
12.1%
Immigrants | Australia
98.1
/100
|
#60
Exceptional
12.2%
Immigrants | Asia
98.1
/100
|
#61
Exceptional
12.2%
Immigrants | Italy
98.0
/100
|
#62
Exceptional
12.2%
Ukrainians
98.0
/100
|
#63
Exceptional
12.2%
Germans
98.0
/100
|
#64
Exceptional
12.2%
Indians (Asian)
97.9
/100
|
#65
Exceptional
12.2%
Austrians
97.9
/100
|
#66
Exceptional
12.2%
Immigrants | Eastern Asia
97.8
/100
|
#67
Exceptional
12.2%