Venezuelan vs Nonimmigrants Disability
COMPARE
Venezuelan
Nonimmigrants
Disability
Disability Comparison
Venezuelans
Nonimmigrants
10.5%
DISABILITY
100.0/ 100
METRIC RATING
24th/ 347
METRIC RANK
13.2%
DISABILITY
0.0/ 100
METRIC RATING
295th/ 347
METRIC RANK
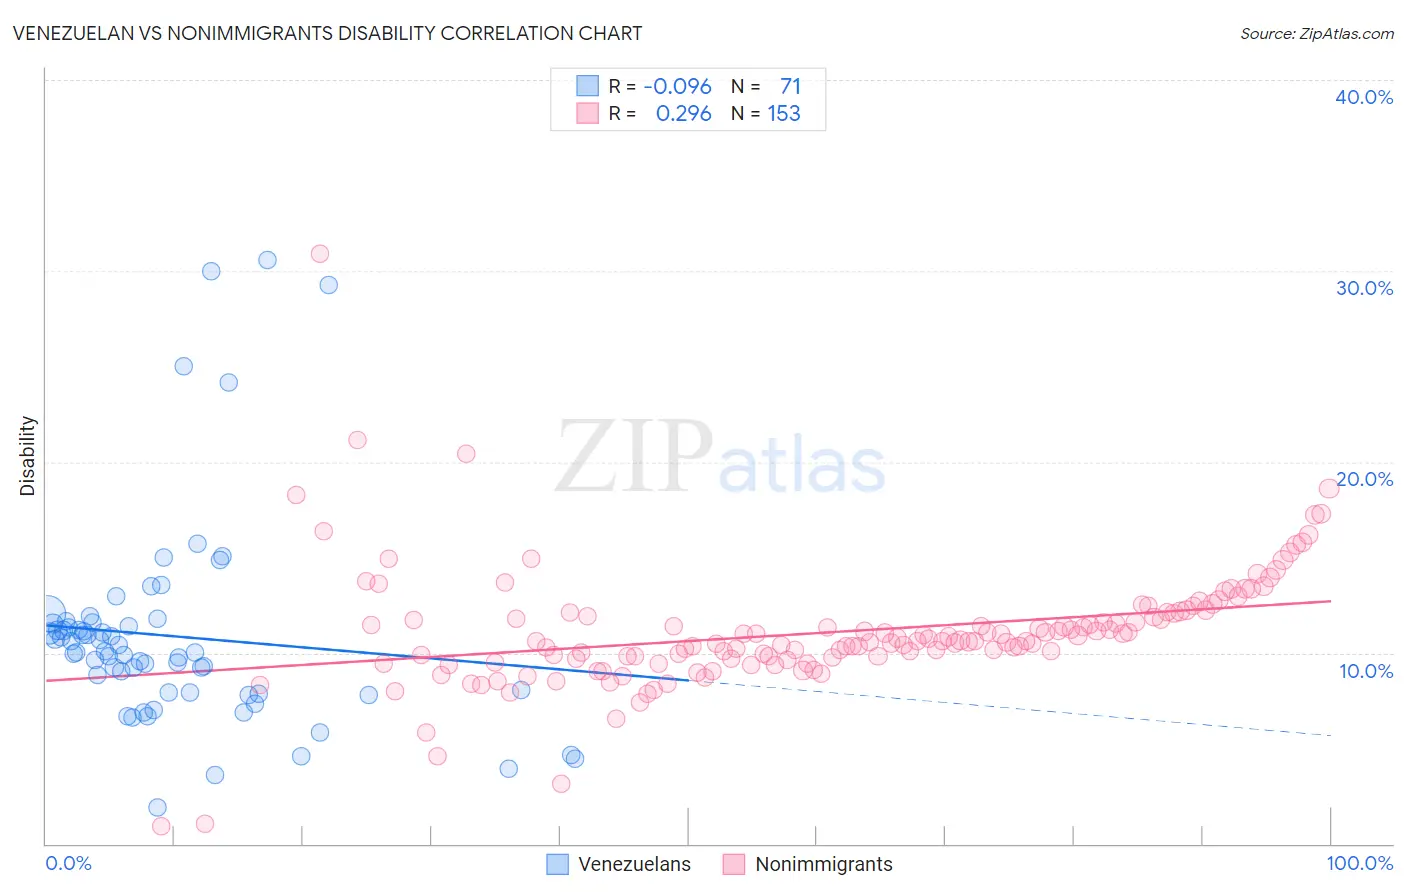
Venezuelan vs Nonimmigrants Disability Correlation Chart
The statistical analysis conducted on geographies consisting of 306,306,571 people shows a slight negative correlation between the proportion of Venezuelans and percentage of population with a disability in the United States with a correlation coefficient (R) of -0.096 and weighted average of 10.5%. Similarly, the statistical analysis conducted on geographies consisting of 585,046,981 people shows a weak positive correlation between the proportion of Nonimmigrants and percentage of population with a disability in the United States with a correlation coefficient (R) of 0.296 and weighted average of 13.2%, a difference of 24.8%.
Disability Correlation Summary
| Measurement | Venezuelan | Nonimmigrants |
| Minimum | 1.9% | 0.89% |
| Maximum | 30.5% | 30.9% |
| Range | 28.6% | 30.0% |
| Mean | 10.9% | 11.1% |
| Median | 10.0% | 10.6% |
| Interquartile 25% (IQ1) | 7.9% | 9.7% |
| Interquartile 75% (IQ3) | 11.5% | 12.1% |
| Interquartile Range (IQR) | 3.6% | 2.4% |
| Standard Deviation (Sample) | 5.5% | 3.2% |
| Standard Deviation (Population) | 5.4% | 3.2% |
Similar Demographics by Disability
Demographics Similar to Venezuelans by Disability
In terms of disability, the demographic groups most similar to Venezuelans are Immigrants from Asia (10.5%, a difference of 0.14%), Immigrants from Malaysia (10.6%, a difference of 0.38%), Argentinean (10.6%, a difference of 0.43%), Cypriot (10.6%, a difference of 0.44%), and Egyptian (10.6%, a difference of 0.57%).
| Demographics | Rating | Rank | Disability |
| Immigrants | Iran | 100.0 /100 | #17 | Exceptional 10.3% |
| Burmese | 100.0 /100 | #18 | Exceptional 10.4% |
| Immigrants | Pakistan | 100.0 /100 | #19 | Exceptional 10.4% |
| Immigrants | Venezuela | 100.0 /100 | #20 | Exceptional 10.4% |
| Asians | 100.0 /100 | #21 | Exceptional 10.4% |
| Immigrants | Sri Lanka | 100.0 /100 | #22 | Exceptional 10.5% |
| Immigrants | Asia | 100.0 /100 | #23 | Exceptional 10.5% |
| Venezuelans | 100.0 /100 | #24 | Exceptional 10.5% |
| Immigrants | Malaysia | 100.0 /100 | #25 | Exceptional 10.6% |
| Argentineans | 100.0 /100 | #26 | Exceptional 10.6% |
| Cypriots | 100.0 /100 | #27 | Exceptional 10.6% |
| Egyptians | 100.0 /100 | #28 | Exceptional 10.6% |
| Immigrants | Argentina | 100.0 /100 | #29 | Exceptional 10.6% |
| Immigrants | Turkey | 100.0 /100 | #30 | Exceptional 10.6% |
| Immigrants | Egypt | 100.0 /100 | #31 | Exceptional 10.6% |
Demographics Similar to Nonimmigrants by Disability
In terms of disability, the demographic groups most similar to Nonimmigrants are Central American Indian (13.2%, a difference of 0.040%), Hopi (13.2%, a difference of 0.10%), Alaska Native (13.2%, a difference of 0.11%), Celtic (13.1%, a difference of 0.12%), and French (13.2%, a difference of 0.12%).
| Demographics | Rating | Rank | Disability |
| Whites/Caucasians | 0.0 /100 | #288 | Tragic 13.0% |
| Slovaks | 0.0 /100 | #289 | Tragic 13.0% |
| Cheyenne | 0.0 /100 | #290 | Tragic 13.0% |
| Yaqui | 0.0 /100 | #291 | Tragic 13.1% |
| Aleuts | 0.0 /100 | #292 | Tragic 13.1% |
| Marshallese | 0.0 /100 | #293 | Tragic 13.1% |
| Celtics | 0.0 /100 | #294 | Tragic 13.1% |
| Immigrants | Nonimmigrants | 0.0 /100 | #295 | Tragic 13.2% |
| Central American Indians | 0.0 /100 | #296 | Tragic 13.2% |
| Hopi | 0.0 /100 | #297 | Tragic 13.2% |
| Alaska Natives | 0.0 /100 | #298 | Tragic 13.2% |
| French | 0.0 /100 | #299 | Tragic 13.2% |
| Pennsylvania Germans | 0.0 /100 | #300 | Tragic 13.2% |
| Immigrants | Micronesia | 0.0 /100 | #301 | Tragic 13.2% |
| Arapaho | 0.0 /100 | #302 | Tragic 13.2% |