Ute vs Korean Single Father Poverty
COMPARE
Ute
Korean
Single Father Poverty
Single Father Poverty Comparison
Ute
Koreans
18.5%
SINGLE FATHER POVERTY
0.0/ 100
METRIC RATING
304th/ 347
METRIC RANK
14.0%
SINGLE FATHER POVERTY
100.0/ 100
METRIC RATING
10th/ 347
METRIC RANK
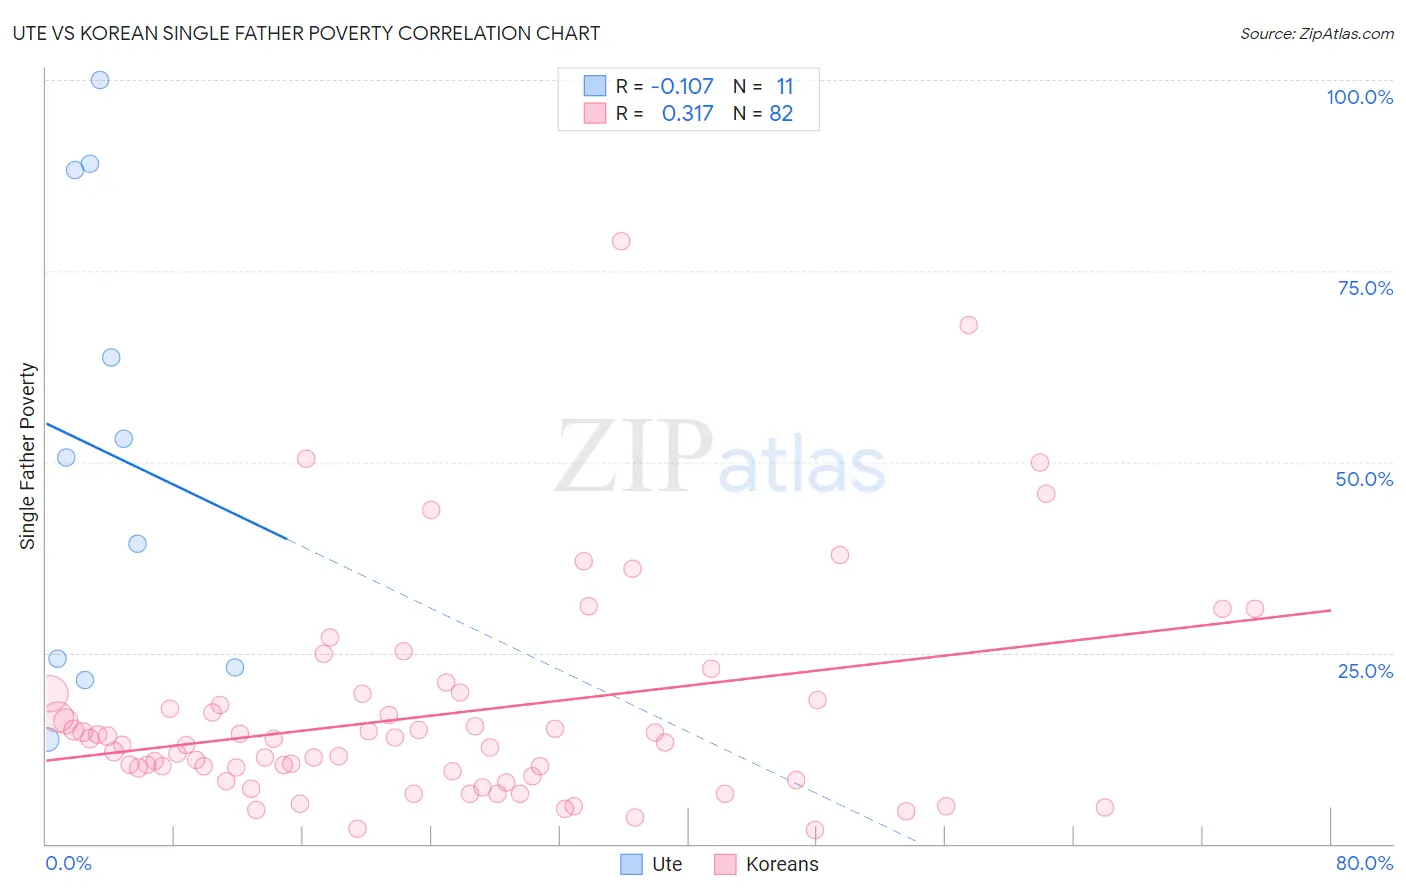
Ute vs Korean Single Father Poverty Correlation Chart
The statistical analysis conducted on geographies consisting of 52,132,597 people shows a poor negative correlation between the proportion of Ute and poverty level among single fathers in the United States with a correlation coefficient (R) of -0.107 and weighted average of 18.5%. Similarly, the statistical analysis conducted on geographies consisting of 383,489,954 people shows a mild positive correlation between the proportion of Koreans and poverty level among single fathers in the United States with a correlation coefficient (R) of 0.317 and weighted average of 14.0%, a difference of 32.5%.
Single Father Poverty Correlation Summary
| Measurement | Ute | Korean |
| Minimum | 13.7% | 1.8% |
| Maximum | 100.0% | 78.9% |
| Range | 86.3% | 77.1% |
| Mean | 51.5% | 16.9% |
| Median | 50.6% | 13.1% |
| Interquartile 25% (IQ1) | 23.1% | 8.8% |
| Interquartile 75% (IQ3) | 88.2% | 18.8% |
| Interquartile Range (IQR) | 65.1% | 9.9% |
| Standard Deviation (Sample) | 30.5% | 14.0% |
| Standard Deviation (Population) | 29.1% | 13.9% |
Similar Demographics by Single Father Poverty
Demographics Similar to Ute by Single Father Poverty
In terms of single father poverty, the demographic groups most similar to Ute are Blackfeet (18.5%, a difference of 0.050%), Celtic (18.5%, a difference of 0.14%), Comanche (18.5%, a difference of 0.18%), Scotch-Irish (18.6%, a difference of 0.27%), and Hungarian (18.5%, a difference of 0.29%).
| Demographics | Rating | Rank | Single Father Poverty |
| French | 0.0 /100 | #297 | Tragic 18.2% |
| Africans | 0.0 /100 | #298 | Tragic 18.3% |
| Whites/Caucasians | 0.0 /100 | #299 | Tragic 18.4% |
| Immigrants | Dominican Republic | 0.0 /100 | #300 | Tragic 18.4% |
| Hungarians | 0.0 /100 | #301 | Tragic 18.5% |
| Comanche | 0.0 /100 | #302 | Tragic 18.5% |
| Celtics | 0.0 /100 | #303 | Tragic 18.5% |
| Ute | 0.0 /100 | #304 | Tragic 18.5% |
| Blackfeet | 0.0 /100 | #305 | Tragic 18.5% |
| Scotch-Irish | 0.0 /100 | #306 | Tragic 18.6% |
| French Canadians | 0.0 /100 | #307 | Tragic 18.6% |
| Ottawa | 0.0 /100 | #308 | Tragic 18.6% |
| Immigrants | Micronesia | 0.0 /100 | #309 | Tragic 18.6% |
| Chippewa | 0.0 /100 | #310 | Tragic 18.8% |
| Immigrants | Nonimmigrants | 0.0 /100 | #311 | Tragic 18.8% |
Demographics Similar to Koreans by Single Father Poverty
In terms of single father poverty, the demographic groups most similar to Koreans are Afghan (14.0%, a difference of 0.10%), Filipino (14.0%, a difference of 0.40%), Immigrants from India (14.0%, a difference of 0.41%), Immigrants from Philippines (14.0%, a difference of 0.55%), and Samoan (13.8%, a difference of 1.2%).
| Demographics | Rating | Rank | Single Father Poverty |
| Tsimshian | 100.0 /100 | #3 | Exceptional 12.7% |
| Immigrants | Fiji | 100.0 /100 | #4 | Exceptional 13.2% |
| Immigrants | Ethiopia | 100.0 /100 | #5 | Exceptional 13.4% |
| Ethiopians | 100.0 /100 | #6 | Exceptional 13.5% |
| Immigrants | Taiwan | 100.0 /100 | #7 | Exceptional 13.7% |
| Samoans | 100.0 /100 | #8 | Exceptional 13.8% |
| Afghans | 100.0 /100 | #9 | Exceptional 14.0% |
| Koreans | 100.0 /100 | #10 | Exceptional 14.0% |
| Filipinos | 100.0 /100 | #11 | Exceptional 14.0% |
| Immigrants | India | 100.0 /100 | #12 | Exceptional 14.0% |
| Immigrants | Philippines | 100.0 /100 | #13 | Exceptional 14.0% |
| Immigrants | Vietnam | 100.0 /100 | #14 | Exceptional 14.1% |
| Sri Lankans | 100.0 /100 | #15 | Exceptional 14.2% |
| Immigrants | Iran | 100.0 /100 | #16 | Exceptional 14.2% |
| Immigrants | Hong Kong | 100.0 /100 | #17 | Exceptional 14.2% |