Ute vs Crow Single Father Poverty
COMPARE
Ute
Crow
Single Father Poverty
Single Father Poverty Comparison
Ute
Crow
18.5%
SINGLE FATHER POVERTY
0.0/ 100
METRIC RATING
304th/ 347
METRIC RANK
30.3%
SINGLE FATHER POVERTY
0.0/ 100
METRIC RATING
345th/ 347
METRIC RANK
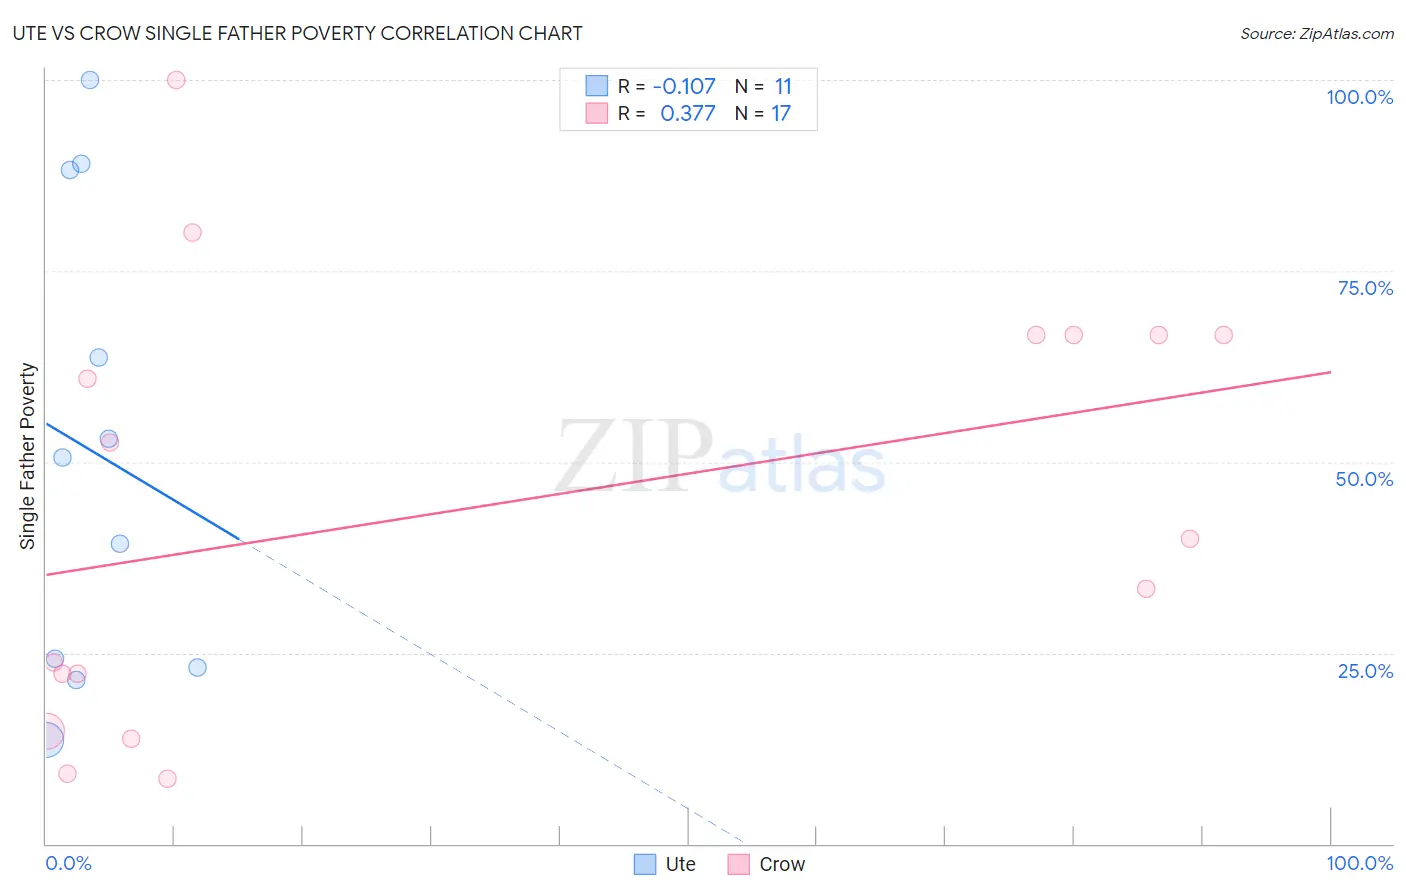
Ute vs Crow Single Father Poverty Correlation Chart
The statistical analysis conducted on geographies consisting of 52,132,597 people shows a poor negative correlation between the proportion of Ute and poverty level among single fathers in the United States with a correlation coefficient (R) of -0.107 and weighted average of 18.5%. Similarly, the statistical analysis conducted on geographies consisting of 55,517,191 people shows a mild positive correlation between the proportion of Crow and poverty level among single fathers in the United States with a correlation coefficient (R) of 0.377 and weighted average of 30.3%, a difference of 63.6%.
Single Father Poverty Correlation Summary
| Measurement | Ute | Crow |
| Minimum | 13.7% | 8.6% |
| Maximum | 100.0% | 100.0% |
| Range | 86.3% | 91.4% |
| Mean | 51.5% | 44.0% |
| Median | 50.6% | 40.0% |
| Interquartile 25% (IQ1) | 23.1% | 18.4% |
| Interquartile 75% (IQ3) | 88.2% | 66.7% |
| Interquartile Range (IQR) | 65.1% | 48.2% |
| Standard Deviation (Sample) | 30.5% | 28.0% |
| Standard Deviation (Population) | 29.1% | 27.2% |
Similar Demographics by Single Father Poverty
Demographics Similar to Ute by Single Father Poverty
In terms of single father poverty, the demographic groups most similar to Ute are Blackfeet (18.5%, a difference of 0.050%), Celtic (18.5%, a difference of 0.14%), Comanche (18.5%, a difference of 0.18%), Scotch-Irish (18.6%, a difference of 0.27%), and Hungarian (18.5%, a difference of 0.29%).
| Demographics | Rating | Rank | Single Father Poverty |
| French | 0.0 /100 | #297 | Tragic 18.2% |
| Africans | 0.0 /100 | #298 | Tragic 18.3% |
| Whites/Caucasians | 0.0 /100 | #299 | Tragic 18.4% |
| Immigrants | Dominican Republic | 0.0 /100 | #300 | Tragic 18.4% |
| Hungarians | 0.0 /100 | #301 | Tragic 18.5% |
| Comanche | 0.0 /100 | #302 | Tragic 18.5% |
| Celtics | 0.0 /100 | #303 | Tragic 18.5% |
| Ute | 0.0 /100 | #304 | Tragic 18.5% |
| Blackfeet | 0.0 /100 | #305 | Tragic 18.5% |
| Scotch-Irish | 0.0 /100 | #306 | Tragic 18.6% |
| French Canadians | 0.0 /100 | #307 | Tragic 18.6% |
| Ottawa | 0.0 /100 | #308 | Tragic 18.6% |
| Immigrants | Micronesia | 0.0 /100 | #309 | Tragic 18.6% |
| Chippewa | 0.0 /100 | #310 | Tragic 18.8% |
| Immigrants | Nonimmigrants | 0.0 /100 | #311 | Tragic 18.8% |
Demographics Similar to Crow by Single Father Poverty
In terms of single father poverty, the demographic groups most similar to Crow are Navajo (29.2%, a difference of 3.6%), Puerto Rican (31.5%, a difference of 4.1%), Lumbee (28.5%, a difference of 6.3%), Yuman (28.4%, a difference of 6.7%), and Yup'ik (32.5%, a difference of 7.4%).
| Demographics | Rating | Rank | Single Father Poverty |
| Natives/Alaskans | 0.0 /100 | #333 | Tragic 22.4% |
| Kiowa | 0.0 /100 | #334 | Tragic 22.5% |
| Shoshone | 0.0 /100 | #335 | Tragic 22.9% |
| Cajuns | 0.0 /100 | #336 | Tragic 23.1% |
| Sioux | 0.0 /100 | #337 | Tragic 23.9% |
| Arapaho | 0.0 /100 | #338 | Tragic 24.0% |
| Apache | 0.0 /100 | #339 | Tragic 24.2% |
| Houma | 0.0 /100 | #340 | Tragic 26.7% |
| Hopi | 0.0 /100 | #341 | Tragic 27.2% |
| Yuman | 0.0 /100 | #342 | Tragic 28.4% |
| Lumbee | 0.0 /100 | #343 | Tragic 28.5% |
| Navajo | 0.0 /100 | #344 | Tragic 29.2% |
| Crow | 0.0 /100 | #345 | Tragic 30.3% |
| Puerto Ricans | 0.0 /100 | #346 | Tragic 31.5% |
| Yup'ik | 0.0 /100 | #347 | Tragic 32.5% |