Bolivian vs Korean Single Father Poverty
COMPARE
Bolivian
Korean
Single Father Poverty
Single Father Poverty Comparison
Bolivians
Koreans
14.7%
SINGLE FATHER POVERTY
100.0/ 100
METRIC RATING
38th/ 347
METRIC RANK
14.0%
SINGLE FATHER POVERTY
100.0/ 100
METRIC RATING
10th/ 347
METRIC RANK
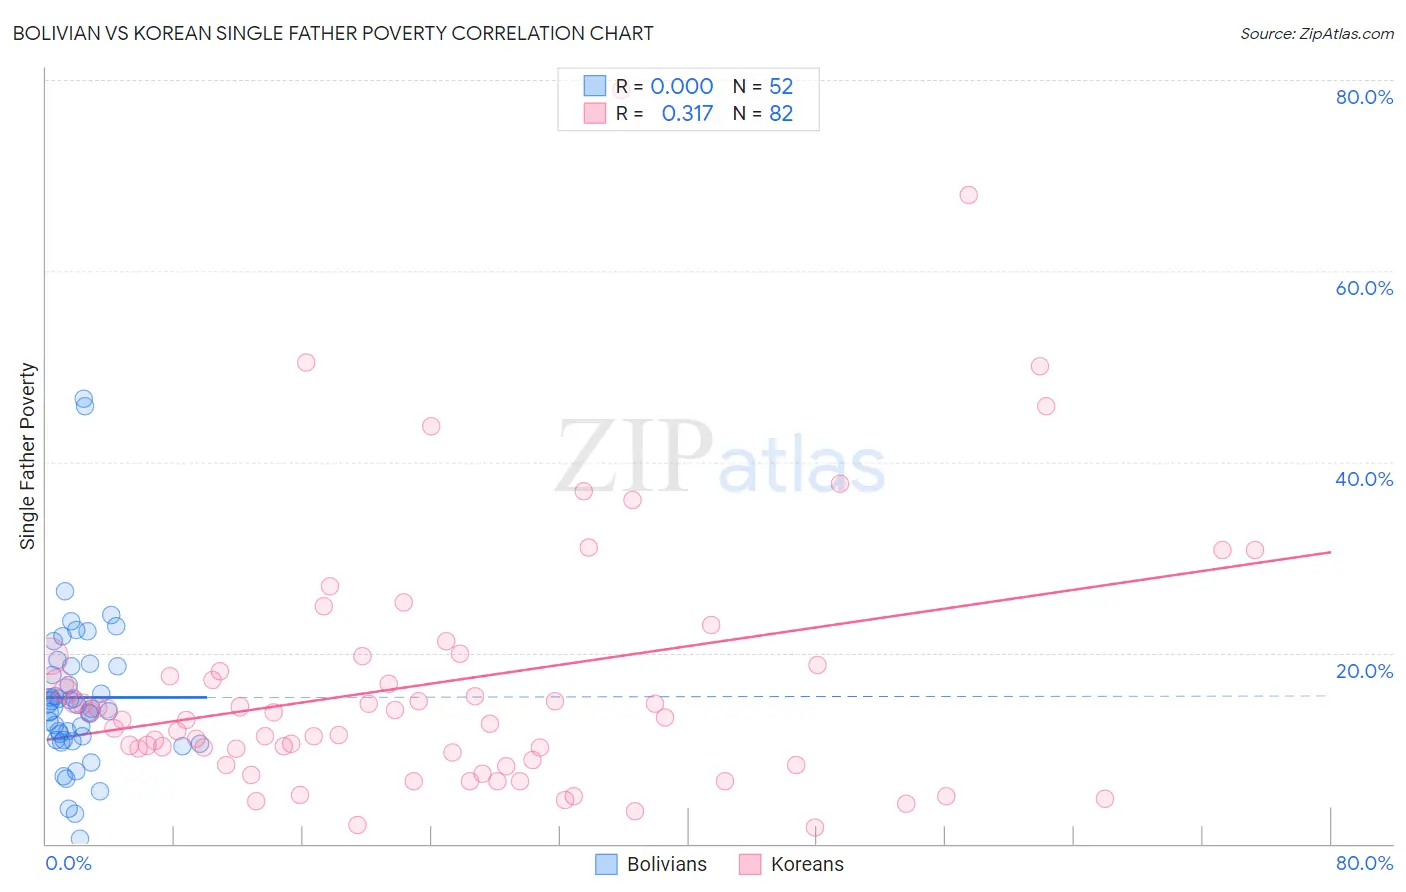
Bolivian vs Korean Single Father Poverty Correlation Chart
The statistical analysis conducted on geographies consisting of 157,877,648 people shows no correlation between the proportion of Bolivians and poverty level among single fathers in the United States with a correlation coefficient (R) of 0.000 and weighted average of 14.7%. Similarly, the statistical analysis conducted on geographies consisting of 383,489,954 people shows a mild positive correlation between the proportion of Koreans and poverty level among single fathers in the United States with a correlation coefficient (R) of 0.317 and weighted average of 14.0%, a difference of 5.3%.
Single Father Poverty Correlation Summary
| Measurement | Bolivian | Korean |
| Minimum | 0.47% | 1.8% |
| Maximum | 46.7% | 78.9% |
| Range | 46.2% | 77.1% |
| Mean | 15.3% | 16.9% |
| Median | 14.3% | 13.1% |
| Interquartile 25% (IQ1) | 10.9% | 8.8% |
| Interquartile 75% (IQ3) | 18.6% | 18.8% |
| Interquartile Range (IQR) | 7.7% | 9.9% |
| Standard Deviation (Sample) | 8.3% | 14.0% |
| Standard Deviation (Population) | 8.2% | 13.9% |
Similar Demographics by Single Father Poverty
Demographics Similar to Bolivians by Single Father Poverty
In terms of single father poverty, the demographic groups most similar to Bolivians are Immigrants from Eastern Africa (14.7%, a difference of 0.010%), Immigrants from Indonesia (14.7%, a difference of 0.14%), Immigrants from Asia (14.7%, a difference of 0.18%), Immigrants from Bolivia (14.7%, a difference of 0.30%), and Egyptian (14.7%, a difference of 0.37%).
| Demographics | Rating | Rank | Single Father Poverty |
| Icelanders | 100.0 /100 | #31 | Exceptional 14.5% |
| Asians | 100.0 /100 | #32 | Exceptional 14.6% |
| Okinawans | 100.0 /100 | #33 | Exceptional 14.6% |
| Egyptians | 100.0 /100 | #34 | Exceptional 14.7% |
| Immigrants | Bolivia | 100.0 /100 | #35 | Exceptional 14.7% |
| Immigrants | Indonesia | 100.0 /100 | #36 | Exceptional 14.7% |
| Immigrants | Eastern Africa | 100.0 /100 | #37 | Exceptional 14.7% |
| Bolivians | 100.0 /100 | #38 | Exceptional 14.7% |
| Immigrants | Asia | 100.0 /100 | #39 | Exceptional 14.7% |
| Pima | 100.0 /100 | #40 | Exceptional 14.8% |
| Indians (Asian) | 100.0 /100 | #41 | Exceptional 14.8% |
| Immigrants | Nepal | 100.0 /100 | #42 | Exceptional 14.8% |
| Immigrants | Eritrea | 100.0 /100 | #43 | Exceptional 14.8% |
| Salvadorans | 100.0 /100 | #44 | Exceptional 14.9% |
| Immigrants | Somalia | 100.0 /100 | #45 | Exceptional 14.9% |
Demographics Similar to Koreans by Single Father Poverty
In terms of single father poverty, the demographic groups most similar to Koreans are Afghan (14.0%, a difference of 0.10%), Filipino (14.0%, a difference of 0.40%), Immigrants from India (14.0%, a difference of 0.41%), Immigrants from Philippines (14.0%, a difference of 0.55%), and Samoan (13.8%, a difference of 1.2%).
| Demographics | Rating | Rank | Single Father Poverty |
| Tsimshian | 100.0 /100 | #3 | Exceptional 12.7% |
| Immigrants | Fiji | 100.0 /100 | #4 | Exceptional 13.2% |
| Immigrants | Ethiopia | 100.0 /100 | #5 | Exceptional 13.4% |
| Ethiopians | 100.0 /100 | #6 | Exceptional 13.5% |
| Immigrants | Taiwan | 100.0 /100 | #7 | Exceptional 13.7% |
| Samoans | 100.0 /100 | #8 | Exceptional 13.8% |
| Afghans | 100.0 /100 | #9 | Exceptional 14.0% |
| Koreans | 100.0 /100 | #10 | Exceptional 14.0% |
| Filipinos | 100.0 /100 | #11 | Exceptional 14.0% |
| Immigrants | India | 100.0 /100 | #12 | Exceptional 14.0% |
| Immigrants | Philippines | 100.0 /100 | #13 | Exceptional 14.0% |
| Immigrants | Vietnam | 100.0 /100 | #14 | Exceptional 14.1% |
| Sri Lankans | 100.0 /100 | #15 | Exceptional 14.2% |
| Immigrants | Iran | 100.0 /100 | #16 | Exceptional 14.2% |
| Immigrants | Hong Kong | 100.0 /100 | #17 | Exceptional 14.2% |