Native/Alaskan vs Korean Single Father Poverty
COMPARE
Native/Alaskan
Korean
Single Father Poverty
Single Father Poverty Comparison
Natives/Alaskans
Koreans
22.4%
SINGLE FATHER POVERTY
0.0/ 100
METRIC RATING
333rd/ 347
METRIC RANK
14.0%
SINGLE FATHER POVERTY
100.0/ 100
METRIC RATING
10th/ 347
METRIC RANK
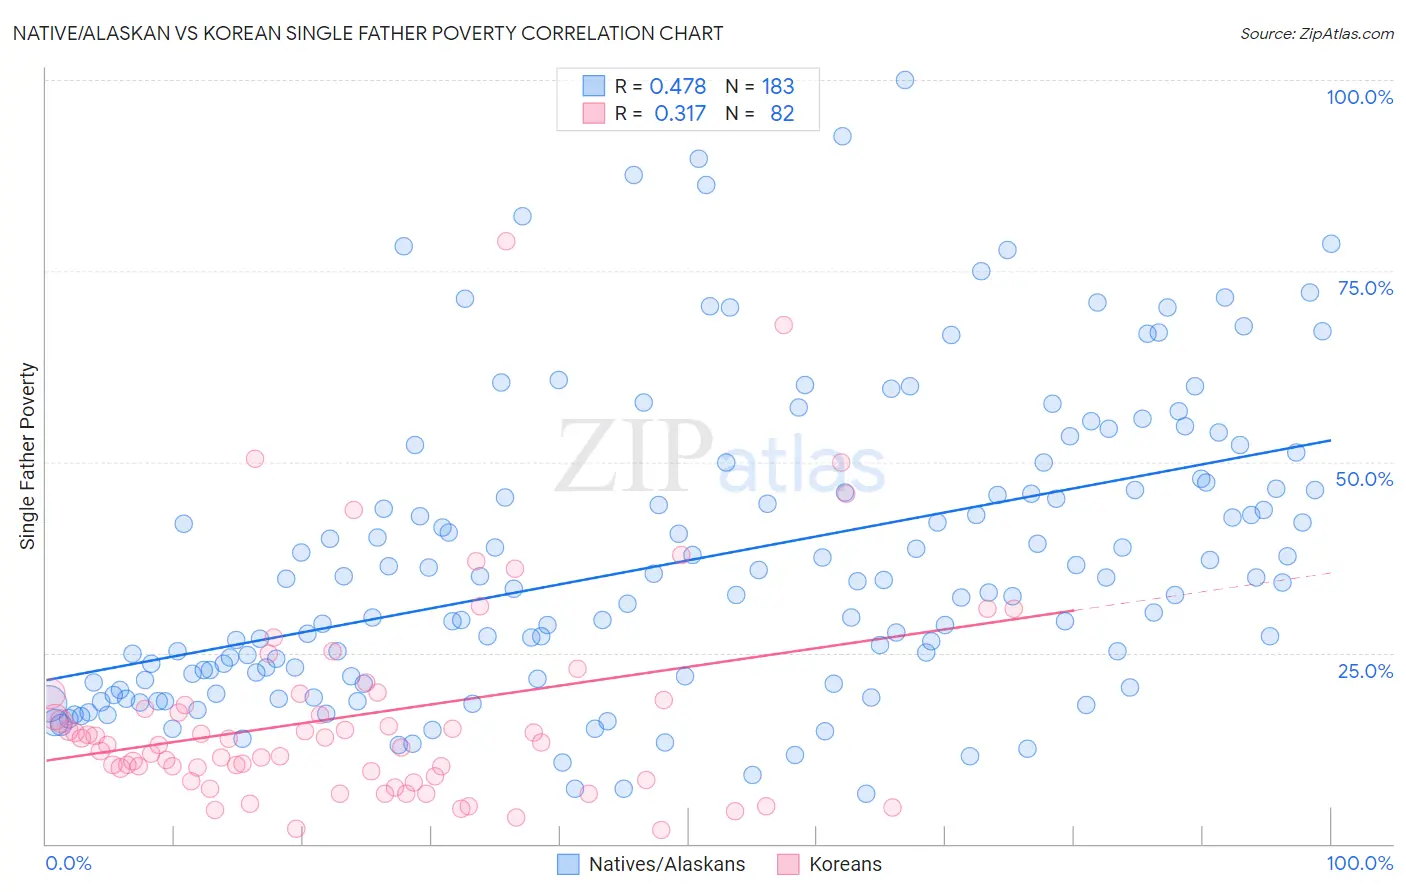
Native/Alaskan vs Korean Single Father Poverty Correlation Chart
The statistical analysis conducted on geographies consisting of 389,194,675 people shows a moderate positive correlation between the proportion of Natives/Alaskans and poverty level among single fathers in the United States with a correlation coefficient (R) of 0.478 and weighted average of 22.4%. Similarly, the statistical analysis conducted on geographies consisting of 383,489,954 people shows a mild positive correlation between the proportion of Koreans and poverty level among single fathers in the United States with a correlation coefficient (R) of 0.317 and weighted average of 14.0%, a difference of 60.3%.
Single Father Poverty Correlation Summary
| Measurement | Native/Alaskan | Korean |
| Minimum | 6.5% | 1.8% |
| Maximum | 100.0% | 78.9% |
| Range | 93.5% | 77.1% |
| Mean | 37.0% | 16.9% |
| Median | 33.3% | 13.1% |
| Interquartile 25% (IQ1) | 21.4% | 8.8% |
| Interquartile 75% (IQ3) | 46.5% | 18.8% |
| Interquartile Range (IQR) | 25.1% | 9.9% |
| Standard Deviation (Sample) | 19.7% | 14.0% |
| Standard Deviation (Population) | 19.7% | 13.9% |
Similar Demographics by Single Father Poverty
Demographics Similar to Natives/Alaskans by Single Father Poverty
In terms of single father poverty, the demographic groups most similar to Natives/Alaskans are Kiowa (22.5%, a difference of 0.36%), Tohono O'odham (22.0%, a difference of 1.7%), Shoshone (22.9%, a difference of 2.3%), Cajun (23.1%, a difference of 3.0%), and Central American Indian (21.7%, a difference of 3.3%).
| Demographics | Rating | Rank | Single Father Poverty |
| Immigrants | Yemen | 0.0 /100 | #326 | Tragic 20.6% |
| Choctaw | 0.0 /100 | #327 | Tragic 20.7% |
| Pueblo | 0.0 /100 | #328 | Tragic 21.1% |
| Colville | 0.0 /100 | #329 | Tragic 21.4% |
| Paiute | 0.0 /100 | #330 | Tragic 21.6% |
| Central American Indians | 0.0 /100 | #331 | Tragic 21.7% |
| Tohono O'odham | 0.0 /100 | #332 | Tragic 22.0% |
| Natives/Alaskans | 0.0 /100 | #333 | Tragic 22.4% |
| Kiowa | 0.0 /100 | #334 | Tragic 22.5% |
| Shoshone | 0.0 /100 | #335 | Tragic 22.9% |
| Cajuns | 0.0 /100 | #336 | Tragic 23.1% |
| Sioux | 0.0 /100 | #337 | Tragic 23.9% |
| Arapaho | 0.0 /100 | #338 | Tragic 24.0% |
| Apache | 0.0 /100 | #339 | Tragic 24.2% |
| Houma | 0.0 /100 | #340 | Tragic 26.7% |
Demographics Similar to Koreans by Single Father Poverty
In terms of single father poverty, the demographic groups most similar to Koreans are Afghan (14.0%, a difference of 0.10%), Filipino (14.0%, a difference of 0.40%), Immigrants from India (14.0%, a difference of 0.41%), Immigrants from Philippines (14.0%, a difference of 0.55%), and Samoan (13.8%, a difference of 1.2%).
| Demographics | Rating | Rank | Single Father Poverty |
| Tsimshian | 100.0 /100 | #3 | Exceptional 12.7% |
| Immigrants | Fiji | 100.0 /100 | #4 | Exceptional 13.2% |
| Immigrants | Ethiopia | 100.0 /100 | #5 | Exceptional 13.4% |
| Ethiopians | 100.0 /100 | #6 | Exceptional 13.5% |
| Immigrants | Taiwan | 100.0 /100 | #7 | Exceptional 13.7% |
| Samoans | 100.0 /100 | #8 | Exceptional 13.8% |
| Afghans | 100.0 /100 | #9 | Exceptional 14.0% |
| Koreans | 100.0 /100 | #10 | Exceptional 14.0% |
| Filipinos | 100.0 /100 | #11 | Exceptional 14.0% |
| Immigrants | India | 100.0 /100 | #12 | Exceptional 14.0% |
| Immigrants | Philippines | 100.0 /100 | #13 | Exceptional 14.0% |
| Immigrants | Vietnam | 100.0 /100 | #14 | Exceptional 14.1% |
| Sri Lankans | 100.0 /100 | #15 | Exceptional 14.2% |
| Immigrants | Iran | 100.0 /100 | #16 | Exceptional 14.2% |
| Immigrants | Hong Kong | 100.0 /100 | #17 | Exceptional 14.2% |