Ute vs Immigrants from Belize Single Father Poverty
COMPARE
Ute
Immigrants from Belize
Single Father Poverty
Single Father Poverty Comparison
Ute
Immigrants from Belize
18.5%
SINGLE FATHER POVERTY
0.0/ 100
METRIC RATING
304th/ 347
METRIC RANK
16.5%
SINGLE FATHER POVERTY
19.8/ 100
METRIC RATING
199th/ 347
METRIC RANK
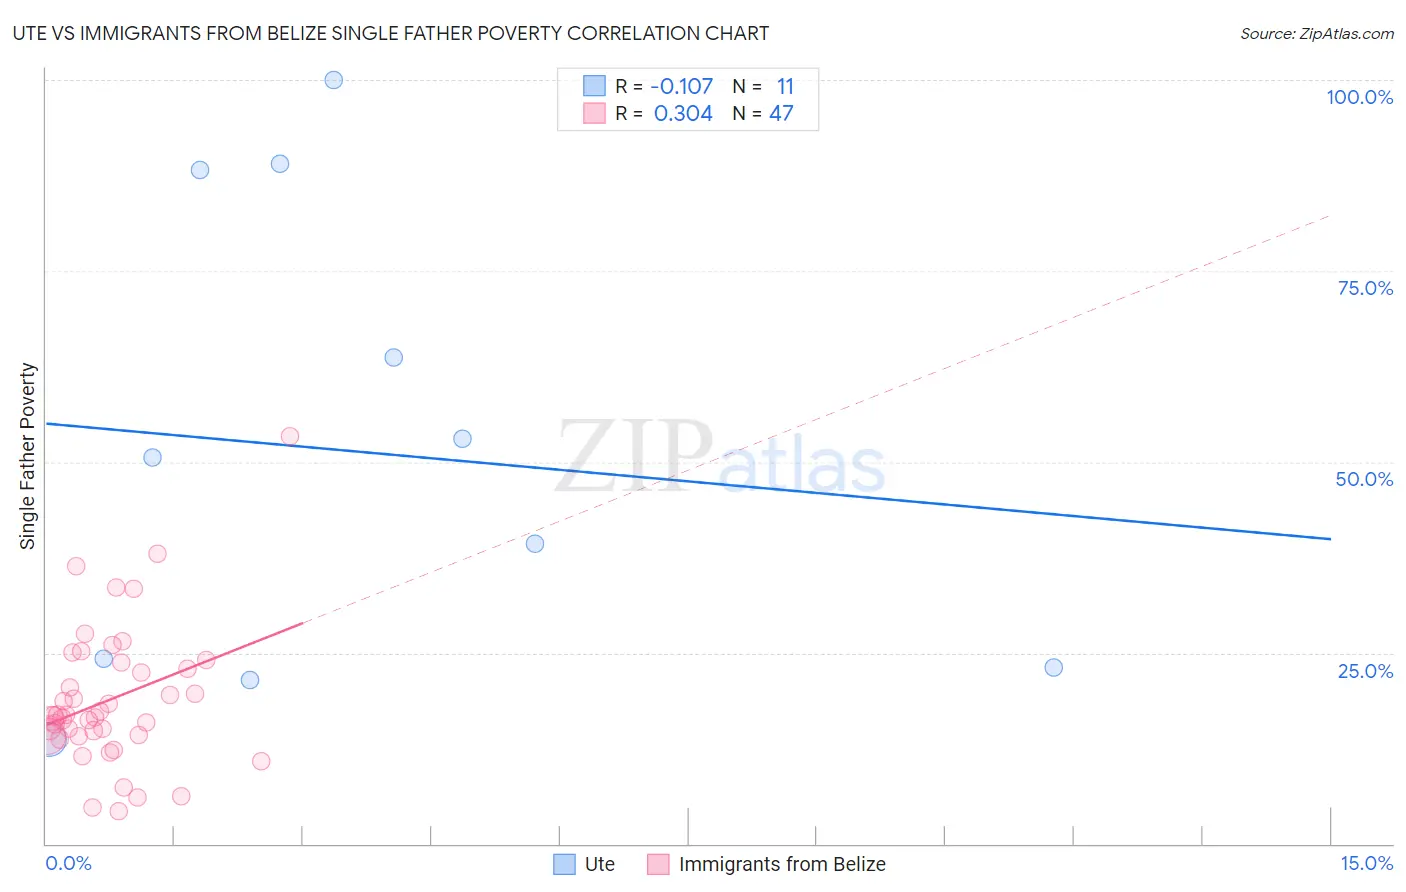
Ute vs Immigrants from Belize Single Father Poverty Correlation Chart
The statistical analysis conducted on geographies consisting of 52,132,597 people shows a poor negative correlation between the proportion of Ute and poverty level among single fathers in the United States with a correlation coefficient (R) of -0.107 and weighted average of 18.5%. Similarly, the statistical analysis conducted on geographies consisting of 118,811,167 people shows a mild positive correlation between the proportion of Immigrants from Belize and poverty level among single fathers in the United States with a correlation coefficient (R) of 0.304 and weighted average of 16.5%, a difference of 11.8%.
Single Father Poverty Correlation Summary
| Measurement | Ute | Immigrants from Belize |
| Minimum | 13.7% | 4.3% |
| Maximum | 100.0% | 53.3% |
| Range | 86.3% | 49.0% |
| Mean | 51.5% | 18.9% |
| Median | 50.6% | 16.7% |
| Interquartile 25% (IQ1) | 23.1% | 14.1% |
| Interquartile 75% (IQ3) | 88.2% | 23.7% |
| Interquartile Range (IQR) | 65.1% | 9.6% |
| Standard Deviation (Sample) | 30.5% | 9.2% |
| Standard Deviation (Population) | 29.1% | 9.1% |
Similar Demographics by Single Father Poverty
Demographics Similar to Ute by Single Father Poverty
In terms of single father poverty, the demographic groups most similar to Ute are Blackfeet (18.5%, a difference of 0.050%), Celtic (18.5%, a difference of 0.14%), Comanche (18.5%, a difference of 0.18%), Scotch-Irish (18.6%, a difference of 0.27%), and Hungarian (18.5%, a difference of 0.29%).
| Demographics | Rating | Rank | Single Father Poverty |
| French | 0.0 /100 | #297 | Tragic 18.2% |
| Africans | 0.0 /100 | #298 | Tragic 18.3% |
| Whites/Caucasians | 0.0 /100 | #299 | Tragic 18.4% |
| Immigrants | Dominican Republic | 0.0 /100 | #300 | Tragic 18.4% |
| Hungarians | 0.0 /100 | #301 | Tragic 18.5% |
| Comanche | 0.0 /100 | #302 | Tragic 18.5% |
| Celtics | 0.0 /100 | #303 | Tragic 18.5% |
| Ute | 0.0 /100 | #304 | Tragic 18.5% |
| Blackfeet | 0.0 /100 | #305 | Tragic 18.5% |
| Scotch-Irish | 0.0 /100 | #306 | Tragic 18.6% |
| French Canadians | 0.0 /100 | #307 | Tragic 18.6% |
| Ottawa | 0.0 /100 | #308 | Tragic 18.6% |
| Immigrants | Micronesia | 0.0 /100 | #309 | Tragic 18.6% |
| Chippewa | 0.0 /100 | #310 | Tragic 18.8% |
| Immigrants | Nonimmigrants | 0.0 /100 | #311 | Tragic 18.8% |
Demographics Similar to Immigrants from Belize by Single Father Poverty
In terms of single father poverty, the demographic groups most similar to Immigrants from Belize are Romanian (16.5%, a difference of 0.020%), Immigrants from Northern Europe (16.5%, a difference of 0.030%), Immigrants from Canada (16.5%, a difference of 0.14%), Syrian (16.6%, a difference of 0.17%), and Cuban (16.6%, a difference of 0.24%).
| Demographics | Rating | Rank | Single Father Poverty |
| Immigrants | Switzerland | 24.8 /100 | #192 | Fair 16.5% |
| Ecuadorians | 24.5 /100 | #193 | Fair 16.5% |
| Cape Verdeans | 24.4 /100 | #194 | Fair 16.5% |
| Immigrants | Barbados | 24.3 /100 | #195 | Fair 16.5% |
| Immigrants | Canada | 21.9 /100 | #196 | Fair 16.5% |
| Immigrants | Northern Europe | 20.3 /100 | #197 | Fair 16.5% |
| Romanians | 20.1 /100 | #198 | Fair 16.5% |
| Immigrants | Belize | 19.8 /100 | #199 | Poor 16.5% |
| Syrians | 17.4 /100 | #200 | Poor 16.6% |
| Cubans | 16.5 /100 | #201 | Poor 16.6% |
| Immigrants | Croatia | 16.5 /100 | #202 | Poor 16.6% |
| Immigrants | North America | 15.1 /100 | #203 | Poor 16.6% |
| Immigrants | Guatemala | 14.8 /100 | #204 | Poor 16.6% |
| Venezuelans | 14.3 /100 | #205 | Poor 16.6% |
| Immigrants | Senegal | 13.7 /100 | #206 | Poor 16.6% |