Ute vs Korean Male Disability
COMPARE
Ute
Korean
Male Disability
Male Disability Comparison
Ute
Koreans
11.6%
MALE DISABILITY
9.4/ 100
METRIC RATING
210th/ 347
METRIC RANK
11.0%
MALE DISABILITY
77.5/ 100
METRIC RATING
146th/ 347
METRIC RANK
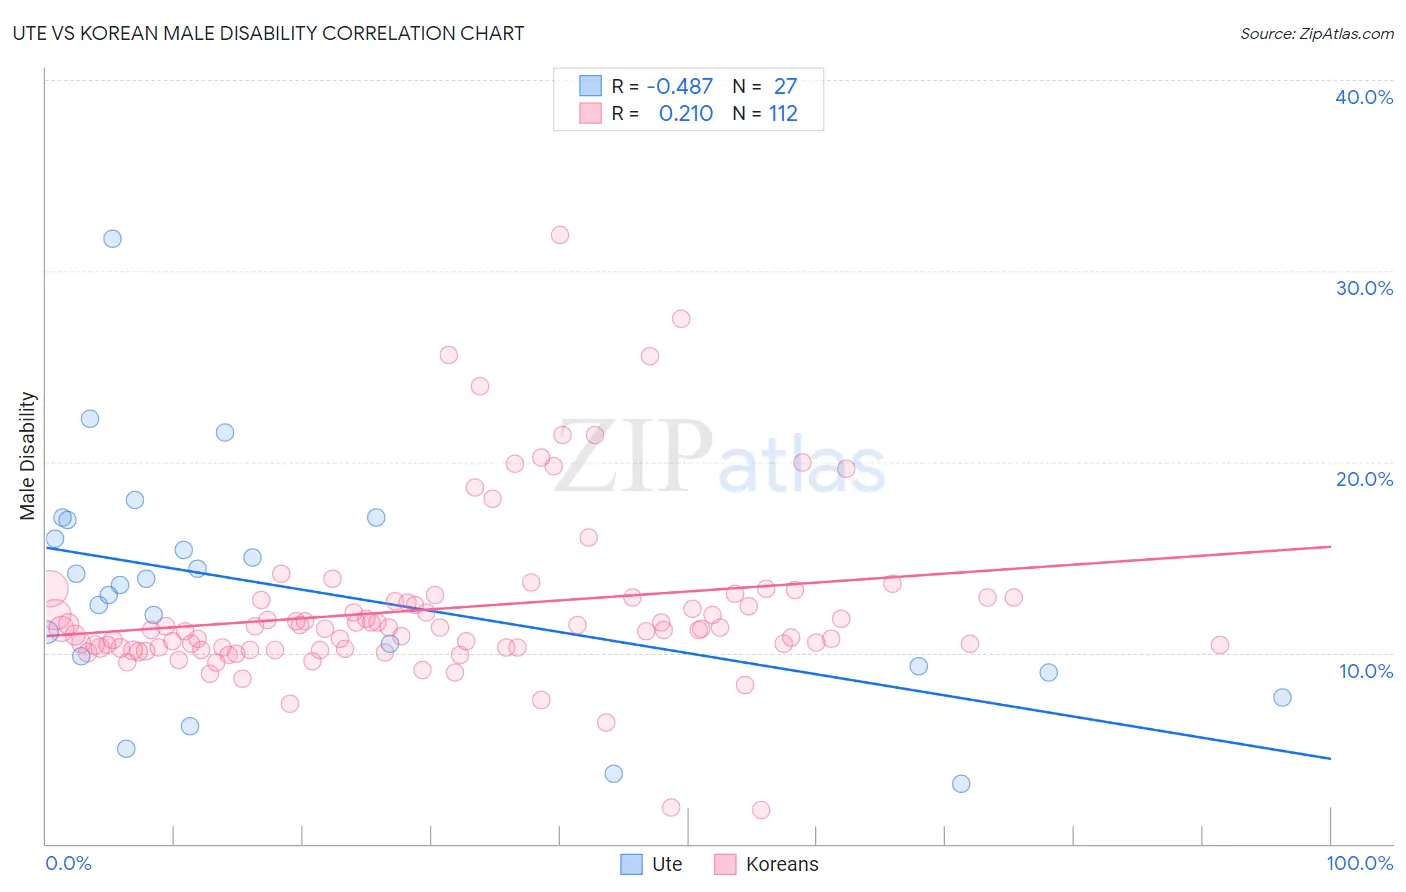
Ute vs Korean Male Disability Correlation Chart
The statistical analysis conducted on geographies consisting of 55,667,753 people shows a moderate negative correlation between the proportion of Ute and percentage of males with a disability in the United States with a correlation coefficient (R) of -0.487 and weighted average of 11.6%. Similarly, the statistical analysis conducted on geographies consisting of 510,777,181 people shows a weak positive correlation between the proportion of Koreans and percentage of males with a disability in the United States with a correlation coefficient (R) of 0.210 and weighted average of 11.0%, a difference of 4.9%.
Male Disability Correlation Summary
| Measurement | Ute | Korean |
| Minimum | 3.1% | 1.8% |
| Maximum | 31.7% | 31.9% |
| Range | 28.5% | 30.1% |
| Mean | 13.3% | 12.3% |
| Median | 13.6% | 11.3% |
| Interquartile 25% (IQ1) | 9.3% | 10.3% |
| Interquartile 75% (IQ3) | 16.9% | 12.8% |
| Interquartile Range (IQR) | 7.6% | 2.5% |
| Standard Deviation (Sample) | 6.1% | 4.5% |
| Standard Deviation (Population) | 6.0% | 4.5% |
Similar Demographics by Male Disability
Demographics Similar to Ute by Male Disability
In terms of male disability, the demographic groups most similar to Ute are Spanish American Indian (11.6%, a difference of 0.10%), Icelander (11.6%, a difference of 0.11%), Immigrants from Somalia (11.5%, a difference of 0.15%), Immigrants from Thailand (11.6%, a difference of 0.17%), and Ukrainian (11.5%, a difference of 0.18%).
| Demographics | Rating | Rank | Male Disability |
| Jamaicans | 10.9 /100 | #203 | Poor 11.5% |
| Immigrants | Cambodia | 10.8 /100 | #204 | Poor 11.5% |
| Serbians | 10.7 /100 | #205 | Poor 11.5% |
| Ukrainians | 10.6 /100 | #206 | Poor 11.5% |
| Immigrants | Somalia | 10.4 /100 | #207 | Poor 11.5% |
| Icelanders | 10.1 /100 | #208 | Poor 11.6% |
| Spanish American Indians | 10.1 /100 | #209 | Poor 11.6% |
| Ute | 9.4 /100 | #210 | Tragic 11.6% |
| Immigrants | Thailand | 8.4 /100 | #211 | Tragic 11.6% |
| Immigrants | Scotland | 8.2 /100 | #212 | Tragic 11.6% |
| Mexican American Indians | 7.8 /100 | #213 | Tragic 11.6% |
| Lithuanians | 6.6 /100 | #214 | Tragic 11.6% |
| Indonesians | 5.9 /100 | #215 | Tragic 11.6% |
| Immigrants | Dominican Republic | 4.9 /100 | #216 | Tragic 11.7% |
| Immigrants | Dominica | 4.6 /100 | #217 | Tragic 11.7% |
Demographics Similar to Koreans by Male Disability
In terms of male disability, the demographic groups most similar to Koreans are Immigrants from Croatia (11.0%, a difference of 0.020%), Sudanese (11.0%, a difference of 0.030%), Costa Rican (11.0%, a difference of 0.040%), Kenyan (11.0%, a difference of 0.050%), and Immigrants from Denmark (11.0%, a difference of 0.090%).
| Demographics | Rating | Rank | Male Disability |
| South Africans | 81.7 /100 | #139 | Excellent 11.0% |
| Immigrants | Italy | 81.5 /100 | #140 | Excellent 11.0% |
| Arabs | 81.5 /100 | #141 | Excellent 11.0% |
| Immigrants | Sudan | 81.5 /100 | #142 | Excellent 11.0% |
| Moroccans | 80.7 /100 | #143 | Excellent 11.0% |
| Kenyans | 78.1 /100 | #144 | Good 11.0% |
| Costa Ricans | 78.0 /100 | #145 | Good 11.0% |
| Koreans | 77.5 /100 | #146 | Good 11.0% |
| Immigrants | Croatia | 77.3 /100 | #147 | Good 11.0% |
| Sudanese | 77.1 /100 | #148 | Good 11.0% |
| Immigrants | Denmark | 76.4 /100 | #149 | Good 11.0% |
| Immigrants | Guatemala | 75.1 /100 | #150 | Good 11.0% |
| Cubans | 74.9 /100 | #151 | Good 11.0% |
| Immigrants | Albania | 74.4 /100 | #152 | Good 11.0% |
| Immigrants | Northern Europe | 73.2 /100 | #153 | Good 11.1% |