Ute vs Immigrants from Romania Single Female Poverty
COMPARE
Ute
Immigrants from Romania
Single Female Poverty
Single Female Poverty Comparison
Ute
Immigrants from Romania
28.4%
SINGLE FEMALE POVERTY
0.0/ 100
METRIC RATING
333rd/ 347
METRIC RANK
18.8%
SINGLE FEMALE POVERTY
99.9/ 100
METRIC RATING
43rd/ 347
METRIC RANK
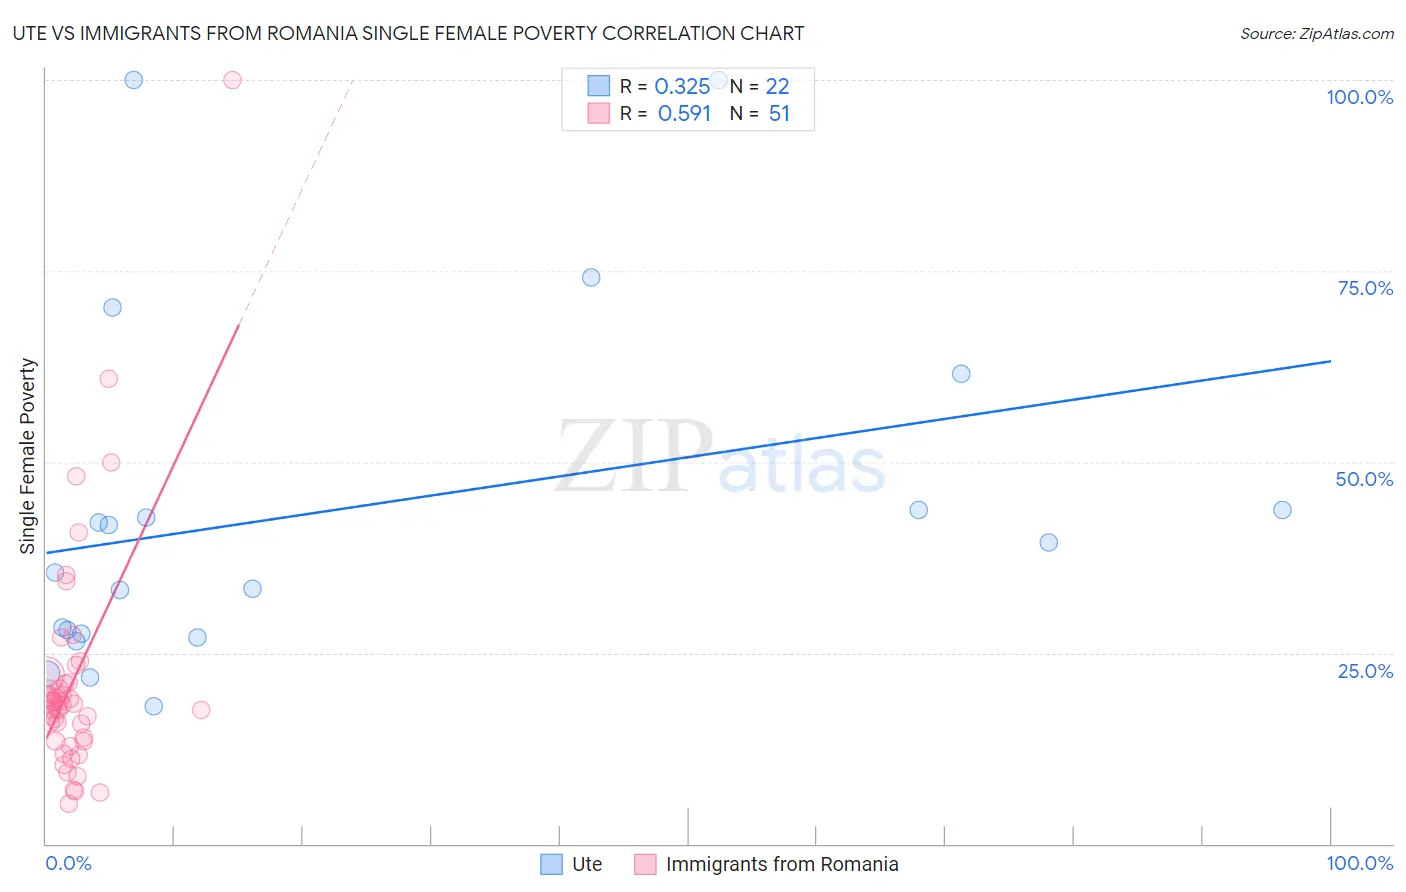
Ute vs Immigrants from Romania Single Female Poverty Correlation Chart
The statistical analysis conducted on geographies consisting of 55,519,789 people shows a mild positive correlation between the proportion of Ute and poverty level among single females in the United States with a correlation coefficient (R) of 0.325 and weighted average of 28.4%. Similarly, the statistical analysis conducted on geographies consisting of 254,376,234 people shows a substantial positive correlation between the proportion of Immigrants from Romania and poverty level among single females in the United States with a correlation coefficient (R) of 0.591 and weighted average of 18.8%, a difference of 50.8%.
Single Female Poverty Correlation Summary
| Measurement | Ute | Immigrants from Romania |
| Minimum | 18.0% | 5.2% |
| Maximum | 100.0% | 100.0% |
| Range | 82.0% | 94.8% |
| Mean | 43.7% | 21.4% |
| Median | 37.5% | 18.3% |
| Interquartile 25% (IQ1) | 27.4% | 13.5% |
| Interquartile 75% (IQ3) | 43.8% | 21.2% |
| Interquartile Range (IQR) | 16.3% | 7.7% |
| Standard Deviation (Sample) | 23.4% | 15.7% |
| Standard Deviation (Population) | 22.9% | 15.5% |
Similar Demographics by Single Female Poverty
Demographics Similar to Ute by Single Female Poverty
In terms of single female poverty, the demographic groups most similar to Ute are Yakama (28.3%, a difference of 0.42%), Native/Alaskan (28.2%, a difference of 0.68%), Pueblo (28.6%, a difference of 0.73%), Hopi (28.0%, a difference of 1.3%), and Immigrants from Yemen (28.9%, a difference of 1.9%).
| Demographics | Rating | Rank | Single Female Poverty |
| Creek | 0.0 /100 | #326 | Tragic 27.4% |
| Dutch West Indians | 0.0 /100 | #327 | Tragic 27.5% |
| Apache | 0.0 /100 | #328 | Tragic 27.7% |
| Menominee | 0.0 /100 | #329 | Tragic 27.8% |
| Hopi | 0.0 /100 | #330 | Tragic 28.0% |
| Natives/Alaskans | 0.0 /100 | #331 | Tragic 28.2% |
| Yakama | 0.0 /100 | #332 | Tragic 28.3% |
| Ute | 0.0 /100 | #333 | Tragic 28.4% |
| Pueblo | 0.0 /100 | #334 | Tragic 28.6% |
| Immigrants | Yemen | 0.0 /100 | #335 | Tragic 28.9% |
| Colville | 0.0 /100 | #336 | Tragic 29.1% |
| Yuman | 0.0 /100 | #337 | Tragic 29.4% |
| Pima | 0.0 /100 | #338 | Tragic 30.3% |
| Cheyenne | 0.0 /100 | #339 | Tragic 30.4% |
| Cajuns | 0.0 /100 | #340 | Tragic 30.6% |
Demographics Similar to Immigrants from Romania by Single Female Poverty
In terms of single female poverty, the demographic groups most similar to Immigrants from Romania are Jordanian (18.8%, a difference of 0.15%), Immigrants from Croatia (18.9%, a difference of 0.17%), Immigrants from Serbia (18.8%, a difference of 0.23%), Okinawan (18.8%, a difference of 0.25%), and Bulgarian (18.8%, a difference of 0.28%).
| Demographics | Rating | Rank | Single Female Poverty |
| Turks | 99.9 /100 | #36 | Exceptional 18.7% |
| Immigrants | Armenia | 99.9 /100 | #37 | Exceptional 18.7% |
| Tongans | 99.9 /100 | #38 | Exceptional 18.8% |
| Bulgarians | 99.9 /100 | #39 | Exceptional 18.8% |
| Okinawans | 99.9 /100 | #40 | Exceptional 18.8% |
| Immigrants | Serbia | 99.9 /100 | #41 | Exceptional 18.8% |
| Jordanians | 99.9 /100 | #42 | Exceptional 18.8% |
| Immigrants | Romania | 99.9 /100 | #43 | Exceptional 18.8% |
| Immigrants | Croatia | 99.9 /100 | #44 | Exceptional 18.9% |
| Immigrants | Indonesia | 99.8 /100 | #45 | Exceptional 18.9% |
| Macedonians | 99.8 /100 | #46 | Exceptional 18.9% |
| Latvians | 99.8 /100 | #47 | Exceptional 19.0% |
| Immigrants | Argentina | 99.8 /100 | #48 | Exceptional 19.0% |
| Immigrants | Czechoslovakia | 99.8 /100 | #49 | Exceptional 19.0% |
| Immigrants | Eastern Europe | 99.8 /100 | #50 | Exceptional 19.0% |