Fijian vs Immigrants from Romania Single Female Poverty
COMPARE
Fijian
Immigrants from Romania
Single Female Poverty
Single Female Poverty Comparison
Fijians
Immigrants from Romania
23.1%
SINGLE FEMALE POVERTY
0.2/ 100
METRIC RATING
268th/ 347
METRIC RANK
18.8%
SINGLE FEMALE POVERTY
99.9/ 100
METRIC RATING
43rd/ 347
METRIC RANK
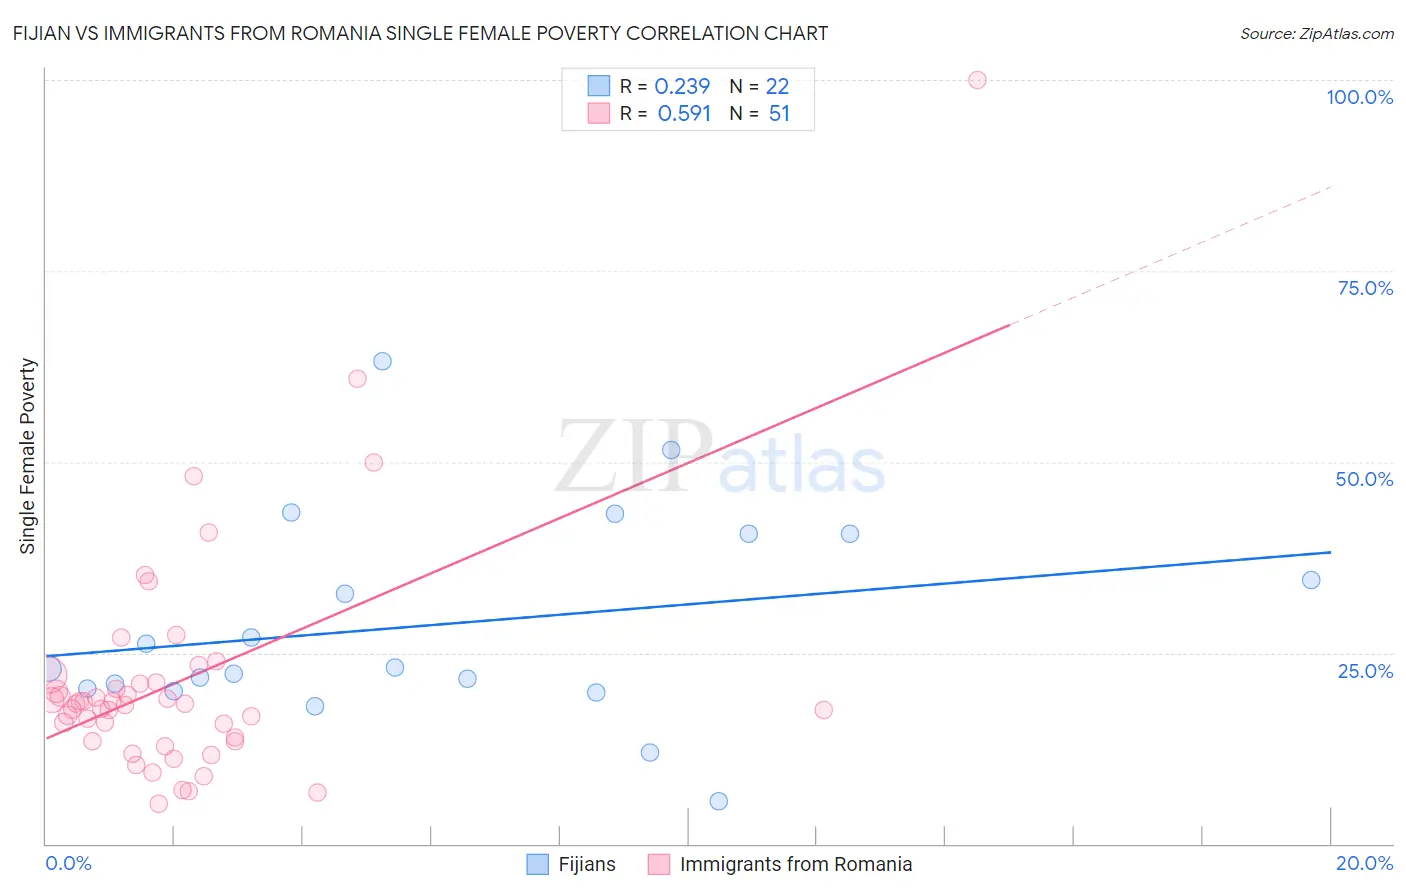
Fijian vs Immigrants from Romania Single Female Poverty Correlation Chart
The statistical analysis conducted on geographies consisting of 55,892,814 people shows a weak positive correlation between the proportion of Fijians and poverty level among single females in the United States with a correlation coefficient (R) of 0.239 and weighted average of 23.1%. Similarly, the statistical analysis conducted on geographies consisting of 254,376,234 people shows a substantial positive correlation between the proportion of Immigrants from Romania and poverty level among single females in the United States with a correlation coefficient (R) of 0.591 and weighted average of 18.8%, a difference of 22.4%.
Single Female Poverty Correlation Summary
| Measurement | Fijian | Immigrants from Romania |
| Minimum | 5.6% | 5.2% |
| Maximum | 63.2% | 100.0% |
| Range | 57.6% | 94.8% |
| Mean | 28.7% | 21.4% |
| Median | 23.0% | 18.3% |
| Interquartile 25% (IQ1) | 20.3% | 13.5% |
| Interquartile 75% (IQ3) | 40.6% | 21.2% |
| Interquartile Range (IQR) | 20.3% | 7.7% |
| Standard Deviation (Sample) | 13.6% | 15.7% |
| Standard Deviation (Population) | 13.3% | 15.5% |
Similar Demographics by Single Female Poverty
Demographics Similar to Fijians by Single Female Poverty
In terms of single female poverty, the demographic groups most similar to Fijians are Hmong (23.1%, a difference of 0.030%), Senegalese (23.0%, a difference of 0.070%), Immigrants from Micronesia (23.0%, a difference of 0.13%), Inupiat (23.1%, a difference of 0.28%), and Central American (23.0%, a difference of 0.34%).
| Demographics | Rating | Rank | Single Female Poverty |
| Immigrants | Cabo Verde | 0.4 /100 | #261 | Tragic 22.8% |
| British West Indians | 0.4 /100 | #262 | Tragic 22.8% |
| Scotch-Irish | 0.3 /100 | #263 | Tragic 22.9% |
| Immigrants | Laos | 0.3 /100 | #264 | Tragic 22.9% |
| Central Americans | 0.2 /100 | #265 | Tragic 23.0% |
| Immigrants | Micronesia | 0.2 /100 | #266 | Tragic 23.0% |
| Senegalese | 0.2 /100 | #267 | Tragic 23.0% |
| Fijians | 0.2 /100 | #268 | Tragic 23.1% |
| Hmong | 0.2 /100 | #269 | Tragic 23.1% |
| Inupiat | 0.2 /100 | #270 | Tragic 23.1% |
| Sub-Saharan Africans | 0.1 /100 | #271 | Tragic 23.2% |
| Immigrants | Senegal | 0.1 /100 | #272 | Tragic 23.2% |
| Alaska Natives | 0.1 /100 | #273 | Tragic 23.3% |
| Marshallese | 0.1 /100 | #274 | Tragic 23.3% |
| Mexican American Indians | 0.1 /100 | #275 | Tragic 23.4% |
Demographics Similar to Immigrants from Romania by Single Female Poverty
In terms of single female poverty, the demographic groups most similar to Immigrants from Romania are Jordanian (18.8%, a difference of 0.15%), Immigrants from Croatia (18.9%, a difference of 0.17%), Immigrants from Serbia (18.8%, a difference of 0.23%), Okinawan (18.8%, a difference of 0.25%), and Bulgarian (18.8%, a difference of 0.28%).
| Demographics | Rating | Rank | Single Female Poverty |
| Turks | 99.9 /100 | #36 | Exceptional 18.7% |
| Immigrants | Armenia | 99.9 /100 | #37 | Exceptional 18.7% |
| Tongans | 99.9 /100 | #38 | Exceptional 18.8% |
| Bulgarians | 99.9 /100 | #39 | Exceptional 18.8% |
| Okinawans | 99.9 /100 | #40 | Exceptional 18.8% |
| Immigrants | Serbia | 99.9 /100 | #41 | Exceptional 18.8% |
| Jordanians | 99.9 /100 | #42 | Exceptional 18.8% |
| Immigrants | Romania | 99.9 /100 | #43 | Exceptional 18.8% |
| Immigrants | Croatia | 99.9 /100 | #44 | Exceptional 18.9% |
| Immigrants | Indonesia | 99.8 /100 | #45 | Exceptional 18.9% |
| Macedonians | 99.8 /100 | #46 | Exceptional 18.9% |
| Latvians | 99.8 /100 | #47 | Exceptional 19.0% |
| Immigrants | Argentina | 99.8 /100 | #48 | Exceptional 19.0% |
| Immigrants | Czechoslovakia | 99.8 /100 | #49 | Exceptional 19.0% |
| Immigrants | Eastern Europe | 99.8 /100 | #50 | Exceptional 19.0% |