Ute vs Bangladeshi Single Female Poverty
COMPARE
Ute
Bangladeshi
Single Female Poverty
Single Female Poverty Comparison
Ute
Bangladeshis
28.4%
SINGLE FEMALE POVERTY
0.0/ 100
METRIC RATING
333rd/ 347
METRIC RANK
24.2%
SINGLE FEMALE POVERTY
0.0/ 100
METRIC RATING
287th/ 347
METRIC RANK
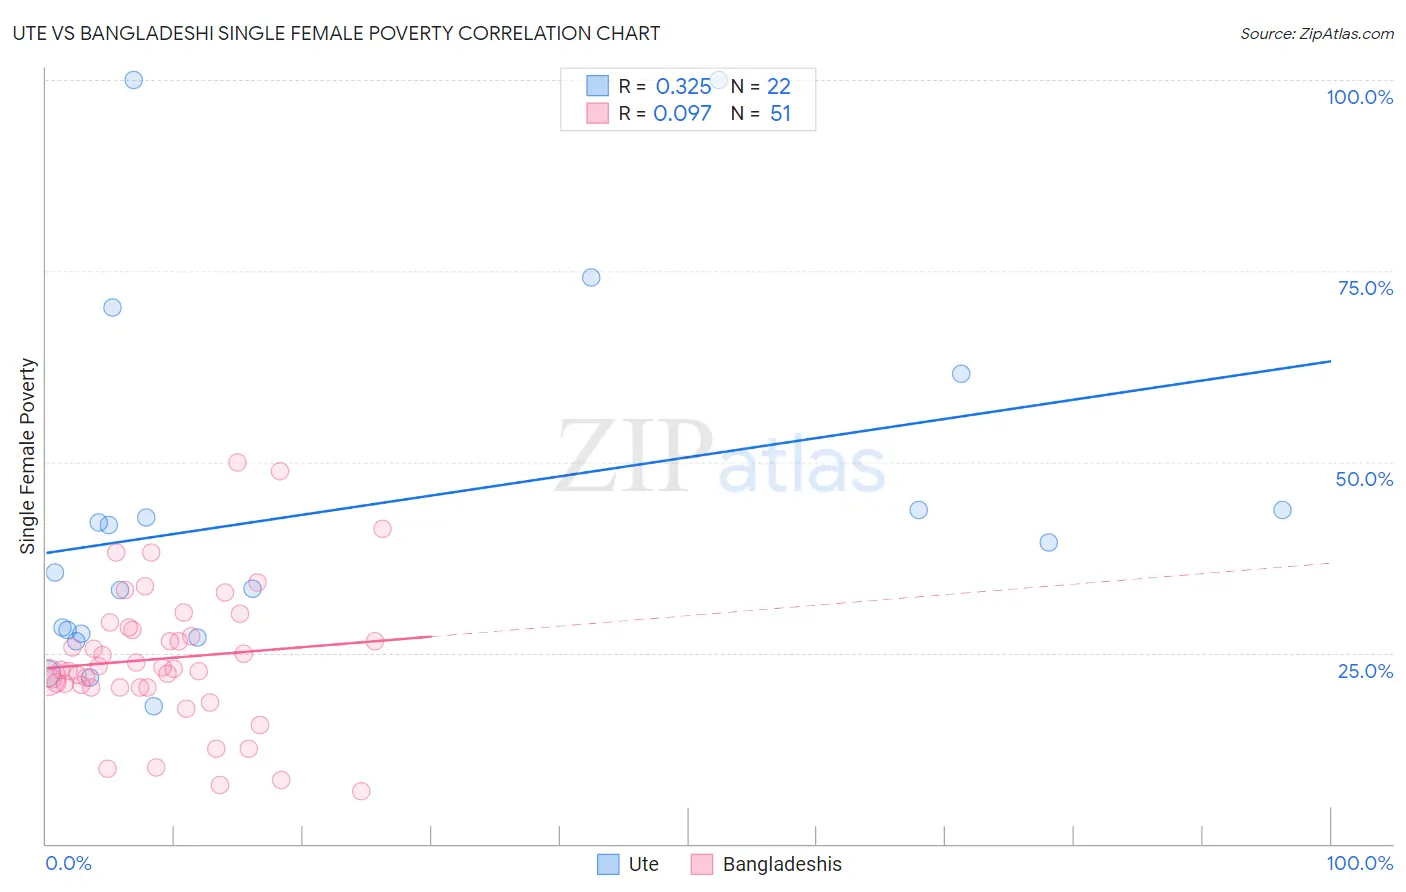
Ute vs Bangladeshi Single Female Poverty Correlation Chart
The statistical analysis conducted on geographies consisting of 55,519,789 people shows a mild positive correlation between the proportion of Ute and poverty level among single females in the United States with a correlation coefficient (R) of 0.325 and weighted average of 28.4%. Similarly, the statistical analysis conducted on geographies consisting of 140,594,140 people shows a slight positive correlation between the proportion of Bangladeshis and poverty level among single females in the United States with a correlation coefficient (R) of 0.097 and weighted average of 24.2%, a difference of 17.6%.
Single Female Poverty Correlation Summary
| Measurement | Ute | Bangladeshi |
| Minimum | 18.0% | 6.9% |
| Maximum | 100.0% | 50.0% |
| Range | 82.0% | 43.1% |
| Mean | 43.7% | 24.3% |
| Median | 37.5% | 22.9% |
| Interquartile 25% (IQ1) | 27.4% | 20.5% |
| Interquartile 75% (IQ3) | 43.8% | 28.3% |
| Interquartile Range (IQR) | 16.3% | 7.8% |
| Standard Deviation (Sample) | 23.4% | 9.2% |
| Standard Deviation (Population) | 22.9% | 9.1% |
Similar Demographics by Single Female Poverty
Demographics Similar to Ute by Single Female Poverty
In terms of single female poverty, the demographic groups most similar to Ute are Yakama (28.3%, a difference of 0.42%), Native/Alaskan (28.2%, a difference of 0.68%), Pueblo (28.6%, a difference of 0.73%), Hopi (28.0%, a difference of 1.3%), and Immigrants from Yemen (28.9%, a difference of 1.9%).
| Demographics | Rating | Rank | Single Female Poverty |
| Creek | 0.0 /100 | #326 | Tragic 27.4% |
| Dutch West Indians | 0.0 /100 | #327 | Tragic 27.5% |
| Apache | 0.0 /100 | #328 | Tragic 27.7% |
| Menominee | 0.0 /100 | #329 | Tragic 27.8% |
| Hopi | 0.0 /100 | #330 | Tragic 28.0% |
| Natives/Alaskans | 0.0 /100 | #331 | Tragic 28.2% |
| Yakama | 0.0 /100 | #332 | Tragic 28.3% |
| Ute | 0.0 /100 | #333 | Tragic 28.4% |
| Pueblo | 0.0 /100 | #334 | Tragic 28.6% |
| Immigrants | Yemen | 0.0 /100 | #335 | Tragic 28.9% |
| Colville | 0.0 /100 | #336 | Tragic 29.1% |
| Yuman | 0.0 /100 | #337 | Tragic 29.4% |
| Pima | 0.0 /100 | #338 | Tragic 30.3% |
| Cheyenne | 0.0 /100 | #339 | Tragic 30.4% |
| Cajuns | 0.0 /100 | #340 | Tragic 30.6% |
Demographics Similar to Bangladeshis by Single Female Poverty
In terms of single female poverty, the demographic groups most similar to Bangladeshis are Spanish American (24.2%, a difference of 0.020%), U.S. Virgin Islander (24.2%, a difference of 0.070%), Cree (24.1%, a difference of 0.15%), Immigrants from Guatemala (24.1%, a difference of 0.19%), and Indonesian (24.3%, a difference of 0.41%).
| Demographics | Rating | Rank | Single Female Poverty |
| Immigrants | Latin America | 0.0 /100 | #280 | Tragic 23.7% |
| Immigrants | Zaire | 0.0 /100 | #281 | Tragic 23.8% |
| Guatemalans | 0.0 /100 | #282 | Tragic 23.8% |
| German Russians | 0.0 /100 | #283 | Tragic 23.9% |
| Immigrants | Dominica | 0.0 /100 | #284 | Tragic 23.9% |
| Immigrants | Guatemala | 0.0 /100 | #285 | Tragic 24.1% |
| Cree | 0.0 /100 | #286 | Tragic 24.1% |
| Bangladeshis | 0.0 /100 | #287 | Tragic 24.2% |
| Spanish Americans | 0.0 /100 | #288 | Tragic 24.2% |
| U.S. Virgin Islanders | 0.0 /100 | #289 | Tragic 24.2% |
| Indonesians | 0.0 /100 | #290 | Tragic 24.3% |
| Osage | 0.0 /100 | #291 | Tragic 24.4% |
| Alsatians | 0.0 /100 | #292 | Tragic 24.5% |
| Americans | 0.0 /100 | #293 | Tragic 24.5% |
| French American Indians | 0.0 /100 | #294 | Tragic 24.6% |