Ukrainian vs Crow Female Poverty
COMPARE
Ukrainian
Crow
Female Poverty
Female Poverty Comparison
Ukrainians
Crow
12.2%
FEMALE POVERTY
98.0/ 100
METRIC RATING
63rd/ 347
METRIC RANK
22.1%
FEMALE POVERTY
0.0/ 100
METRIC RATING
341st/ 347
METRIC RANK
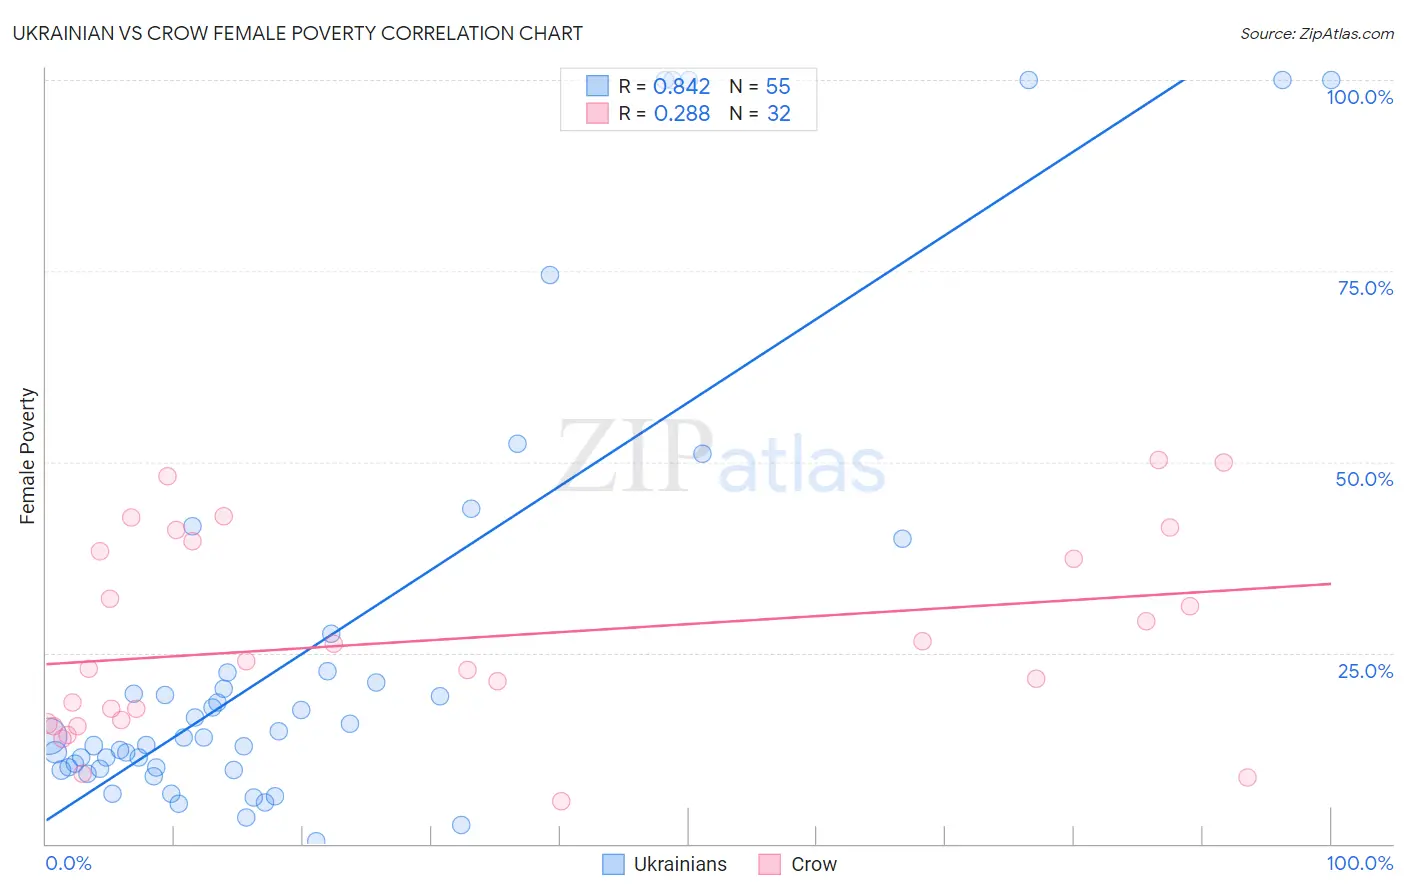
Ukrainian vs Crow Female Poverty Correlation Chart
The statistical analysis conducted on geographies consisting of 448,134,896 people shows a very strong positive correlation between the proportion of Ukrainians and poverty level among females in the United States with a correlation coefficient (R) of 0.842 and weighted average of 12.2%. Similarly, the statistical analysis conducted on geographies consisting of 59,198,506 people shows a weak positive correlation between the proportion of Crow and poverty level among females in the United States with a correlation coefficient (R) of 0.288 and weighted average of 22.1%, a difference of 81.7%.
Female Poverty Correlation Summary
| Measurement | Ukrainian | Crow |
| Minimum | 0.40% | 5.6% |
| Maximum | 100.0% | 50.2% |
| Range | 99.6% | 44.6% |
| Mean | 26.3% | 26.8% |
| Median | 13.9% | 23.4% |
| Interquartile 25% (IQ1) | 9.7% | 16.0% |
| Interquartile 75% (IQ3) | 22.6% | 39.0% |
| Interquartile Range (IQR) | 12.8% | 23.0% |
| Standard Deviation (Sample) | 29.3% | 12.9% |
| Standard Deviation (Population) | 29.1% | 12.7% |
Similar Demographics by Female Poverty
Demographics Similar to Ukrainians by Female Poverty
In terms of female poverty, the demographic groups most similar to Ukrainians are German (12.2%, a difference of 0.030%), Indian (Asian) (12.2%, a difference of 0.060%), Austrian (12.2%, a difference of 0.070%), Immigrants from Italy (12.2%, a difference of 0.080%), and Immigrants from Asia (12.2%, a difference of 0.10%).
| Demographics | Rating | Rank | Female Poverty |
| Estonians | 98.3 /100 | #56 | Exceptional 12.1% |
| Immigrants | Serbia | 98.3 /100 | #57 | Exceptional 12.1% |
| Scandinavians | 98.2 /100 | #58 | Exceptional 12.1% |
| Immigrants | Europe | 98.2 /100 | #59 | Exceptional 12.1% |
| Immigrants | Australia | 98.1 /100 | #60 | Exceptional 12.2% |
| Immigrants | Asia | 98.1 /100 | #61 | Exceptional 12.2% |
| Immigrants | Italy | 98.0 /100 | #62 | Exceptional 12.2% |
| Ukrainians | 98.0 /100 | #63 | Exceptional 12.2% |
| Germans | 98.0 /100 | #64 | Exceptional 12.2% |
| Indians (Asian) | 97.9 /100 | #65 | Exceptional 12.2% |
| Austrians | 97.9 /100 | #66 | Exceptional 12.2% |
| Immigrants | Eastern Asia | 97.8 /100 | #67 | Exceptional 12.2% |
| Immigrants | Netherlands | 97.8 /100 | #68 | Exceptional 12.2% |
| Swiss | 97.7 /100 | #69 | Exceptional 12.2% |
| Immigrants | Belgium | 97.7 /100 | #70 | Exceptional 12.2% |
Demographics Similar to Crow by Female Poverty
In terms of female poverty, the demographic groups most similar to Crow are Yup'ik (21.5%, a difference of 3.0%), Immigrants from Yemen (22.8%, a difference of 3.2%), Hopi (21.0%, a difference of 5.6%), Sioux (20.9%, a difference of 6.0%), and Lumbee (23.5%, a difference of 6.2%).
| Demographics | Rating | Rank | Female Poverty |
| Immigrants | Dominican Republic | 0.0 /100 | #333 | Tragic 19.3% |
| Houma | 0.0 /100 | #334 | Tragic 20.0% |
| Cheyenne | 0.0 /100 | #335 | Tragic 20.2% |
| Pueblo | 0.0 /100 | #336 | Tragic 20.7% |
| Yuman | 0.0 /100 | #337 | Tragic 20.8% |
| Sioux | 0.0 /100 | #338 | Tragic 20.9% |
| Hopi | 0.0 /100 | #339 | Tragic 21.0% |
| Yup'ik | 0.0 /100 | #340 | Tragic 21.5% |
| Crow | 0.0 /100 | #341 | Tragic 22.1% |
| Immigrants | Yemen | 0.0 /100 | #342 | Tragic 22.8% |
| Lumbee | 0.0 /100 | #343 | Tragic 23.5% |
| Pima | 0.0 /100 | #344 | Tragic 23.6% |
| Navajo | 0.0 /100 | #345 | Tragic 23.9% |
| Puerto Ricans | 0.0 /100 | #346 | Tragic 25.2% |
| Tohono O'odham | 0.0 /100 | #347 | Tragic 25.9% |