Delaware vs Crow Female Poverty
COMPARE
Delaware
Crow
Female Poverty
Female Poverty Comparison
Delaware
Crow
13.7%
FEMALE POVERTY
31.1/ 100
METRIC RATING
194th/ 347
METRIC RANK
22.1%
FEMALE POVERTY
0.0/ 100
METRIC RATING
341st/ 347
METRIC RANK
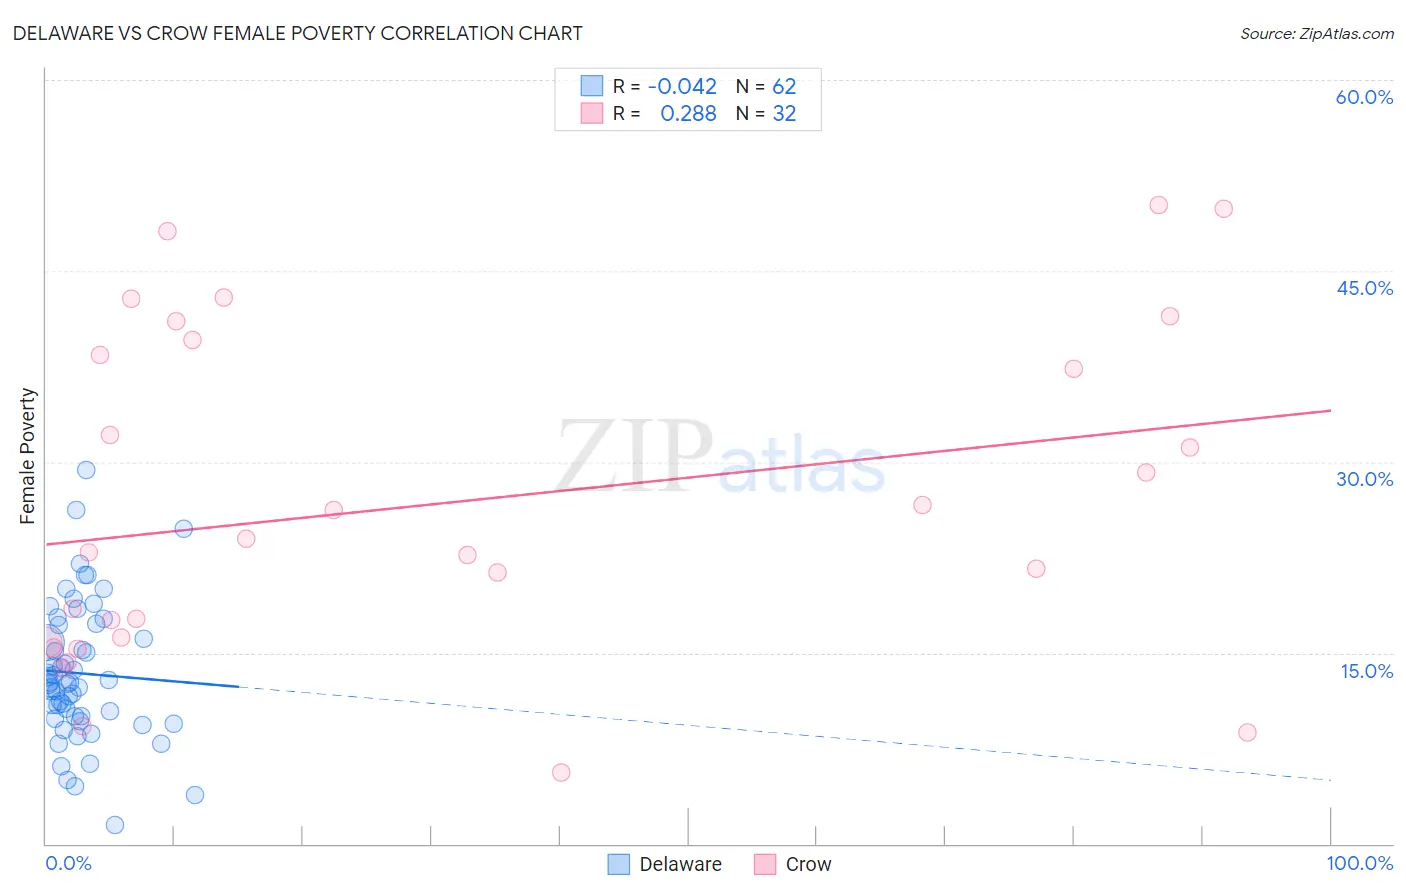
Delaware vs Crow Female Poverty Correlation Chart
The statistical analysis conducted on geographies consisting of 96,212,785 people shows no correlation between the proportion of Delaware and poverty level among females in the United States with a correlation coefficient (R) of -0.042 and weighted average of 13.7%. Similarly, the statistical analysis conducted on geographies consisting of 59,198,506 people shows a weak positive correlation between the proportion of Crow and poverty level among females in the United States with a correlation coefficient (R) of 0.288 and weighted average of 22.1%, a difference of 61.6%.
Female Poverty Correlation Summary
| Measurement | Delaware | Crow |
| Minimum | 1.5% | 5.6% |
| Maximum | 29.4% | 50.2% |
| Range | 27.9% | 44.6% |
| Mean | 13.4% | 26.8% |
| Median | 12.6% | 23.4% |
| Interquartile 25% (IQ1) | 10.0% | 16.0% |
| Interquartile 75% (IQ3) | 17.2% | 39.0% |
| Interquartile Range (IQR) | 7.2% | 23.0% |
| Standard Deviation (Sample) | 5.4% | 12.9% |
| Standard Deviation (Population) | 5.4% | 12.7% |
Similar Demographics by Female Poverty
Demographics Similar to Delaware by Female Poverty
In terms of female poverty, the demographic groups most similar to Delaware are Immigrants from South America (13.7%, a difference of 0.060%), Iraqi (13.7%, a difference of 0.070%), Immigrants from Costa Rica (13.7%, a difference of 0.080%), Immigrants from Kuwait (13.7%, a difference of 0.17%), and Sierra Leonean (13.7%, a difference of 0.21%).
| Demographics | Rating | Rank | Female Poverty |
| Immigrants | Venezuela | 41.0 /100 | #187 | Average 13.6% |
| Hawaiians | 39.9 /100 | #188 | Fair 13.6% |
| Uruguayans | 39.8 /100 | #189 | Fair 13.6% |
| Sierra Leoneans | 33.1 /100 | #190 | Fair 13.7% |
| Immigrants | Kuwait | 32.7 /100 | #191 | Fair 13.7% |
| Immigrants | Costa Rica | 31.9 /100 | #192 | Fair 13.7% |
| Iraqis | 31.8 /100 | #193 | Fair 13.7% |
| Delaware | 31.1 /100 | #194 | Fair 13.7% |
| Immigrants | South America | 30.6 /100 | #195 | Fair 13.7% |
| South American Indians | 28.9 /100 | #196 | Fair 13.7% |
| Arabs | 28.6 /100 | #197 | Fair 13.7% |
| Immigrants | Uganda | 28.5 /100 | #198 | Fair 13.7% |
| Immigrants | Lebanon | 25.6 /100 | #199 | Fair 13.8% |
| Spanish | 21.4 /100 | #200 | Fair 13.9% |
| Immigrants | Kenya | 21.1 /100 | #201 | Fair 13.9% |
Demographics Similar to Crow by Female Poverty
In terms of female poverty, the demographic groups most similar to Crow are Yup'ik (21.5%, a difference of 3.0%), Immigrants from Yemen (22.8%, a difference of 3.2%), Hopi (21.0%, a difference of 5.6%), Sioux (20.9%, a difference of 6.0%), and Lumbee (23.5%, a difference of 6.2%).
| Demographics | Rating | Rank | Female Poverty |
| Immigrants | Dominican Republic | 0.0 /100 | #333 | Tragic 19.3% |
| Houma | 0.0 /100 | #334 | Tragic 20.0% |
| Cheyenne | 0.0 /100 | #335 | Tragic 20.2% |
| Pueblo | 0.0 /100 | #336 | Tragic 20.7% |
| Yuman | 0.0 /100 | #337 | Tragic 20.8% |
| Sioux | 0.0 /100 | #338 | Tragic 20.9% |
| Hopi | 0.0 /100 | #339 | Tragic 21.0% |
| Yup'ik | 0.0 /100 | #340 | Tragic 21.5% |
| Crow | 0.0 /100 | #341 | Tragic 22.1% |
| Immigrants | Yemen | 0.0 /100 | #342 | Tragic 22.8% |
| Lumbee | 0.0 /100 | #343 | Tragic 23.5% |
| Pima | 0.0 /100 | #344 | Tragic 23.6% |
| Navajo | 0.0 /100 | #345 | Tragic 23.9% |
| Puerto Ricans | 0.0 /100 | #346 | Tragic 25.2% |
| Tohono O'odham | 0.0 /100 | #347 | Tragic 25.9% |