Belgian vs Immigrants from Jamaica Receiving Food Stamps
COMPARE
Belgian
Immigrants from Jamaica
Receiving Food Stamps
Receiving Food Stamps Comparison
Belgians
Immigrants from Jamaica
10.2%
RECEIVING FOOD STAMPS
97.7/ 100
METRIC RATING
93rd/ 347
METRIC RANK
16.9%
RECEIVING FOOD STAMPS
0.0/ 100
METRIC RATING
313th/ 347
METRIC RANK
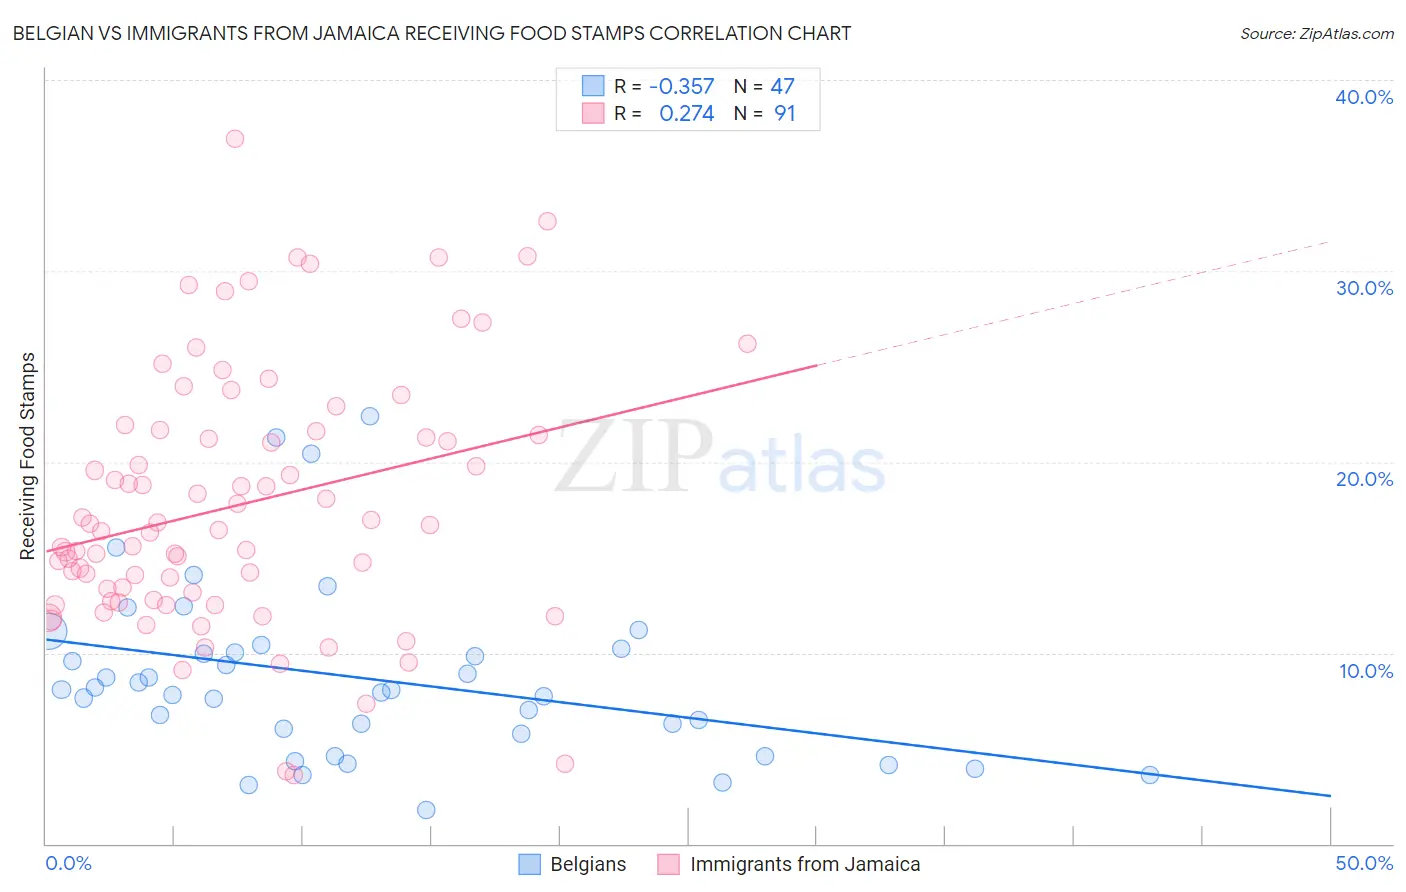
Belgian vs Immigrants from Jamaica Receiving Food Stamps Correlation Chart
The statistical analysis conducted on geographies consisting of 355,046,721 people shows a mild negative correlation between the proportion of Belgians and percentage of population receiving government assistance and/or food stamps in the United States with a correlation coefficient (R) of -0.357 and weighted average of 10.2%. Similarly, the statistical analysis conducted on geographies consisting of 301,234,933 people shows a weak positive correlation between the proportion of Immigrants from Jamaica and percentage of population receiving government assistance and/or food stamps in the United States with a correlation coefficient (R) of 0.274 and weighted average of 16.9%, a difference of 65.5%.
Receiving Food Stamps Correlation Summary
| Measurement | Belgian | Immigrants from Jamaica |
| Minimum | 1.8% | 3.6% |
| Maximum | 22.4% | 36.9% |
| Range | 20.6% | 33.3% |
| Mean | 8.7% | 17.7% |
| Median | 8.1% | 16.4% |
| Interquartile 25% (IQ1) | 5.8% | 12.8% |
| Interquartile 75% (IQ3) | 10.2% | 21.6% |
| Interquartile Range (IQR) | 4.4% | 8.8% |
| Standard Deviation (Sample) | 4.6% | 6.7% |
| Standard Deviation (Population) | 4.5% | 6.7% |
Similar Demographics by Receiving Food Stamps
Demographics Similar to Belgians by Receiving Food Stamps
In terms of receiving food stamps, the demographic groups most similar to Belgians are Irish (10.2%, a difference of 0.38%), Jordanian (10.2%, a difference of 0.39%), Finnish (10.2%, a difference of 0.42%), Immigrants from Greece (10.3%, a difference of 0.53%), and Basque (10.3%, a difference of 0.55%).
| Demographics | Rating | Rank | Receiving Food Stamps |
| Immigrants | Norway | 98.4 /100 | #86 | Exceptional 10.0% |
| Egyptians | 98.4 /100 | #87 | Exceptional 10.0% |
| Immigrants | Kuwait | 98.4 /100 | #88 | Exceptional 10.0% |
| Immigrants | France | 98.3 /100 | #89 | Exceptional 10.1% |
| Finns | 97.9 /100 | #90 | Exceptional 10.2% |
| Jordanians | 97.9 /100 | #91 | Exceptional 10.2% |
| Irish | 97.9 /100 | #92 | Exceptional 10.2% |
| Belgians | 97.7 /100 | #93 | Exceptional 10.2% |
| Immigrants | Greece | 97.4 /100 | #94 | Exceptional 10.3% |
| Basques | 97.4 /100 | #95 | Exceptional 10.3% |
| Welsh | 97.3 /100 | #96 | Exceptional 10.3% |
| Czechoslovakians | 97.2 /100 | #97 | Exceptional 10.3% |
| Immigrants | Egypt | 97.1 /100 | #98 | Exceptional 10.3% |
| Serbians | 97.0 /100 | #99 | Exceptional 10.3% |
| Immigrants | Western Europe | 96.9 /100 | #100 | Exceptional 10.3% |
Demographics Similar to Immigrants from Jamaica by Receiving Food Stamps
In terms of receiving food stamps, the demographic groups most similar to Immigrants from Jamaica are Immigrants from Guyana (16.9%, a difference of 0.17%), Sioux (16.8%, a difference of 0.28%), Bahamian (17.0%, a difference of 0.74%), Guyanese (16.7%, a difference of 0.98%), and Central American Indian (17.1%, a difference of 1.2%).
| Demographics | Rating | Rank | Receiving Food Stamps |
| Jamaicans | 0.0 /100 | #306 | Tragic 16.4% |
| Houma | 0.0 /100 | #307 | Tragic 16.5% |
| Barbadians | 0.0 /100 | #308 | Tragic 16.5% |
| U.S. Virgin Islanders | 0.0 /100 | #309 | Tragic 16.5% |
| Immigrants | Barbados | 0.0 /100 | #310 | Tragic 16.6% |
| Guyanese | 0.0 /100 | #311 | Tragic 16.7% |
| Sioux | 0.0 /100 | #312 | Tragic 16.8% |
| Immigrants | Jamaica | 0.0 /100 | #313 | Tragic 16.9% |
| Immigrants | Guyana | 0.0 /100 | #314 | Tragic 16.9% |
| Bahamians | 0.0 /100 | #315 | Tragic 17.0% |
| Central American Indians | 0.0 /100 | #316 | Tragic 17.1% |
| Blacks/African Americans | 0.0 /100 | #317 | Tragic 17.2% |
| Menominee | 0.0 /100 | #318 | Tragic 17.2% |
| Immigrants | St. Vincent and the Grenadines | 0.0 /100 | #319 | Tragic 17.2% |
| Immigrants | Nicaragua | 0.0 /100 | #320 | Tragic 17.2% |