South American Indian vs Immigrants from Jamaica Receiving Food Stamps
COMPARE
South American Indian
Immigrants from Jamaica
Receiving Food Stamps
Receiving Food Stamps Comparison
South American Indians
Immigrants from Jamaica
11.9%
RECEIVING FOOD STAMPS
41.7/ 100
METRIC RATING
181st/ 347
METRIC RANK
16.9%
RECEIVING FOOD STAMPS
0.0/ 100
METRIC RATING
313th/ 347
METRIC RANK
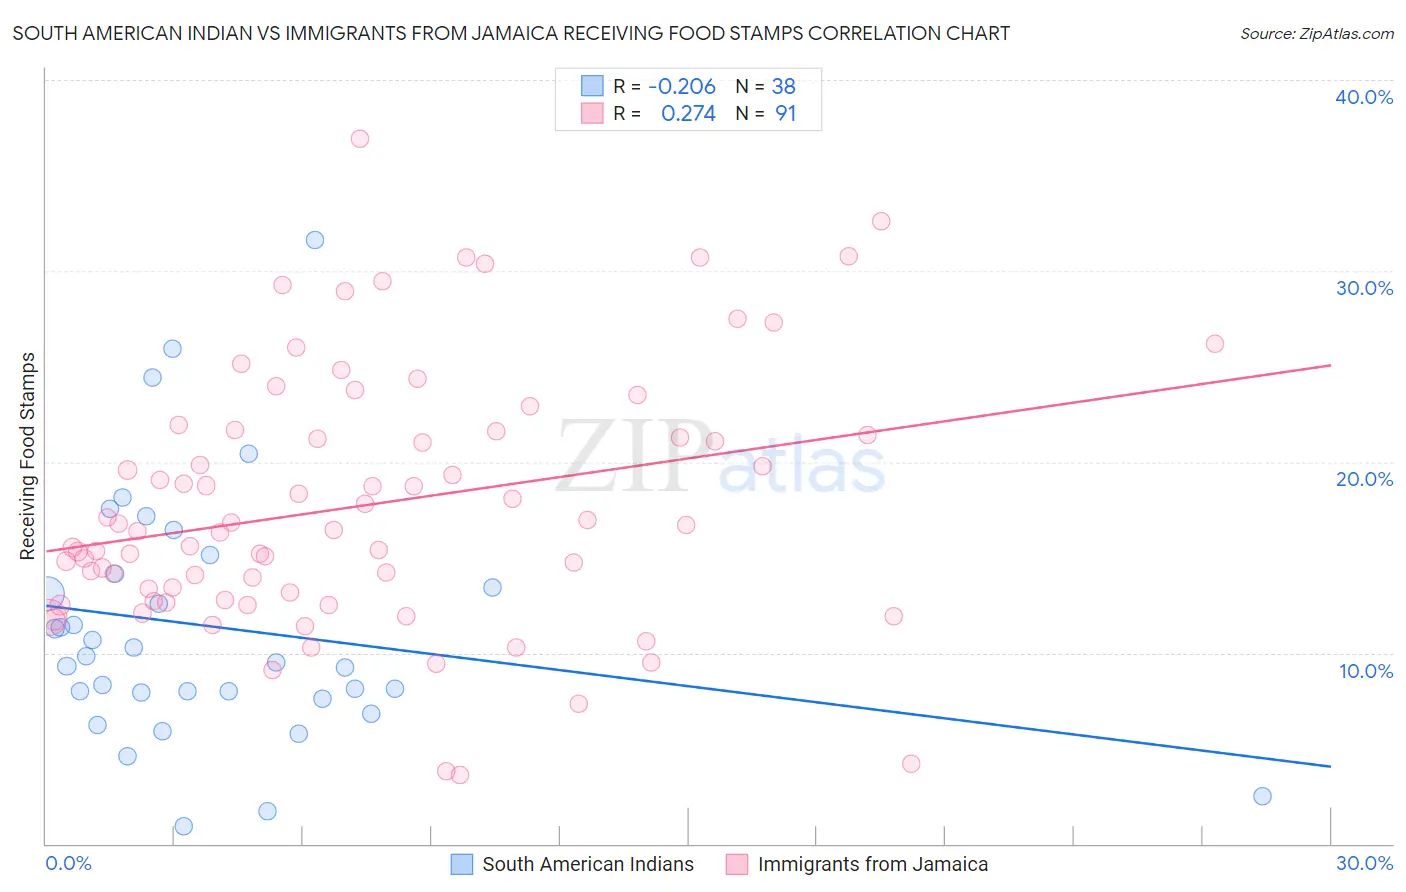
South American Indian vs Immigrants from Jamaica Receiving Food Stamps Correlation Chart
The statistical analysis conducted on geographies consisting of 164,403,103 people shows a weak negative correlation between the proportion of South American Indians and percentage of population receiving government assistance and/or food stamps in the United States with a correlation coefficient (R) of -0.206 and weighted average of 11.9%. Similarly, the statistical analysis conducted on geographies consisting of 301,234,933 people shows a weak positive correlation between the proportion of Immigrants from Jamaica and percentage of population receiving government assistance and/or food stamps in the United States with a correlation coefficient (R) of 0.274 and weighted average of 16.9%, a difference of 42.1%.
Receiving Food Stamps Correlation Summary
| Measurement | South American Indian | Immigrants from Jamaica |
| Minimum | 0.90% | 3.6% |
| Maximum | 31.6% | 36.9% |
| Range | 30.7% | 33.3% |
| Mean | 11.3% | 17.7% |
| Median | 9.7% | 16.4% |
| Interquartile 25% (IQ1) | 7.9% | 12.8% |
| Interquartile 75% (IQ3) | 14.1% | 21.6% |
| Interquartile Range (IQR) | 6.2% | 8.8% |
| Standard Deviation (Sample) | 6.6% | 6.7% |
| Standard Deviation (Population) | 6.5% | 6.7% |
Similar Demographics by Receiving Food Stamps
Demographics Similar to South American Indians by Receiving Food Stamps
In terms of receiving food stamps, the demographic groups most similar to South American Indians are Immigrants from Morocco (11.9%, a difference of 0.15%), Immigrants from Uganda (11.9%, a difference of 0.20%), Spaniard (11.9%, a difference of 0.28%), Uruguayan (11.8%, a difference of 0.44%), and Immigrants from Kenya (11.8%, a difference of 0.66%).
| Demographics | Rating | Rank | Receiving Food Stamps |
| Immigrants | Eritrea | 50.0 /100 | #174 | Average 11.7% |
| Osage | 49.8 /100 | #175 | Average 11.7% |
| Peruvians | 49.3 /100 | #176 | Average 11.7% |
| Immigrants | Ukraine | 48.4 /100 | #177 | Average 11.8% |
| German Russians | 48.1 /100 | #178 | Average 11.8% |
| Immigrants | Kenya | 46.4 /100 | #179 | Average 11.8% |
| Uruguayans | 44.8 /100 | #180 | Average 11.8% |
| South American Indians | 41.7 /100 | #181 | Average 11.9% |
| Immigrants | Morocco | 40.7 /100 | #182 | Average 11.9% |
| Immigrants | Uganda | 40.3 /100 | #183 | Average 11.9% |
| Spaniards | 39.8 /100 | #184 | Fair 11.9% |
| Immigrants | Iraq | 37.1 /100 | #185 | Fair 12.0% |
| Spanish | 36.9 /100 | #186 | Fair 12.0% |
| Albanians | 35.4 /100 | #187 | Fair 12.0% |
| Sudanese | 33.4 /100 | #188 | Fair 12.0% |
Demographics Similar to Immigrants from Jamaica by Receiving Food Stamps
In terms of receiving food stamps, the demographic groups most similar to Immigrants from Jamaica are Immigrants from Guyana (16.9%, a difference of 0.17%), Sioux (16.8%, a difference of 0.28%), Bahamian (17.0%, a difference of 0.74%), Guyanese (16.7%, a difference of 0.98%), and Central American Indian (17.1%, a difference of 1.2%).
| Demographics | Rating | Rank | Receiving Food Stamps |
| Jamaicans | 0.0 /100 | #306 | Tragic 16.4% |
| Houma | 0.0 /100 | #307 | Tragic 16.5% |
| Barbadians | 0.0 /100 | #308 | Tragic 16.5% |
| U.S. Virgin Islanders | 0.0 /100 | #309 | Tragic 16.5% |
| Immigrants | Barbados | 0.0 /100 | #310 | Tragic 16.6% |
| Guyanese | 0.0 /100 | #311 | Tragic 16.7% |
| Sioux | 0.0 /100 | #312 | Tragic 16.8% |
| Immigrants | Jamaica | 0.0 /100 | #313 | Tragic 16.9% |
| Immigrants | Guyana | 0.0 /100 | #314 | Tragic 16.9% |
| Bahamians | 0.0 /100 | #315 | Tragic 17.0% |
| Central American Indians | 0.0 /100 | #316 | Tragic 17.1% |
| Blacks/African Americans | 0.0 /100 | #317 | Tragic 17.2% |
| Menominee | 0.0 /100 | #318 | Tragic 17.2% |
| Immigrants | St. Vincent and the Grenadines | 0.0 /100 | #319 | Tragic 17.2% |
| Immigrants | Nicaragua | 0.0 /100 | #320 | Tragic 17.2% |