Immigrants from Burma/Myanmar vs Immigrants from Liberia Single Father Poverty
COMPARE
Immigrants from Burma/Myanmar
Immigrants from Liberia
Single Father Poverty
Single Father Poverty Comparison
Immigrants from Burma/Myanmar
Immigrants from Liberia
16.5%
SINGLE FATHER POVERTY
28.0/ 100
METRIC RATING
190th/ 347
METRIC RANK
15.9%
SINGLE FATHER POVERTY
91.1/ 100
METRIC RATING
127th/ 347
METRIC RANK
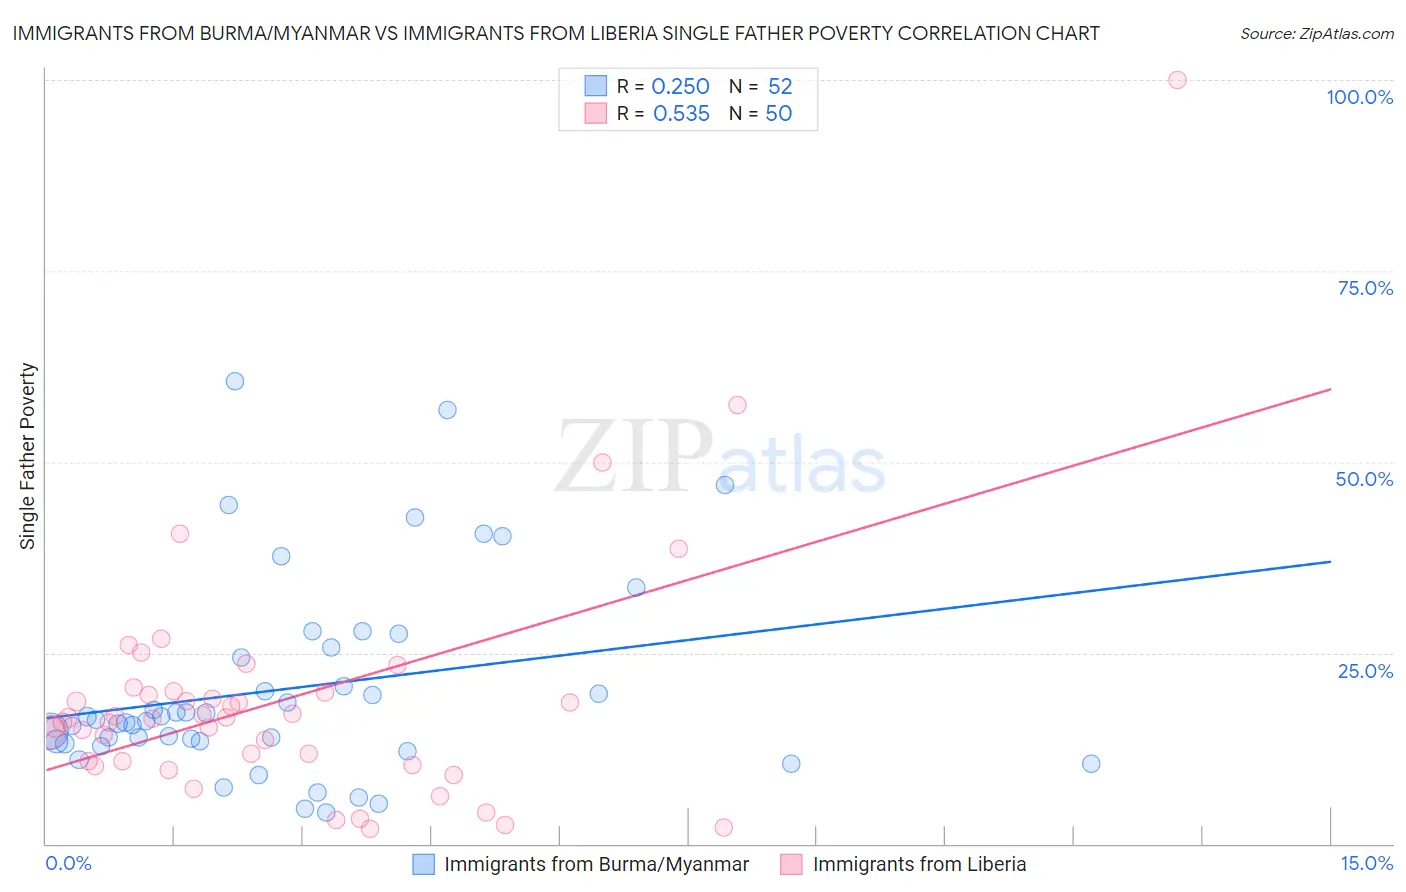
Immigrants from Burma/Myanmar vs Immigrants from Liberia Single Father Poverty Correlation Chart
The statistical analysis conducted on geographies consisting of 151,197,682 people shows a weak positive correlation between the proportion of Immigrants from Burma/Myanmar and poverty level among single fathers in the United States with a correlation coefficient (R) of 0.250 and weighted average of 16.5%. Similarly, the statistical analysis conducted on geographies consisting of 122,784,105 people shows a substantial positive correlation between the proportion of Immigrants from Liberia and poverty level among single fathers in the United States with a correlation coefficient (R) of 0.535 and weighted average of 15.9%, a difference of 3.7%.
Single Father Poverty Correlation Summary
| Measurement | Immigrants from Burma/Myanmar | Immigrants from Liberia |
| Minimum | 4.1% | 2.0% |
| Maximum | 60.6% | 100.0% |
| Range | 56.5% | 98.0% |
| Mean | 20.3% | 18.7% |
| Median | 16.1% | 16.5% |
| Interquartile 25% (IQ1) | 13.3% | 10.8% |
| Interquartile 75% (IQ3) | 25.0% | 19.8% |
| Interquartile Range (IQR) | 11.8% | 9.0% |
| Standard Deviation (Sample) | 13.0% | 16.1% |
| Standard Deviation (Population) | 12.9% | 15.9% |
Similar Demographics by Single Father Poverty
Demographics Similar to Immigrants from Burma/Myanmar by Single Father Poverty
In terms of single father poverty, the demographic groups most similar to Immigrants from Burma/Myanmar are Latvian (16.5%, a difference of 0.050%), Immigrants from Guyana (16.5%, a difference of 0.050%), Russian (16.4%, a difference of 0.11%), Ukrainian (16.4%, a difference of 0.12%), and Immigrants from Venezuela (16.4%, a difference of 0.16%).
| Demographics | Rating | Rank | Single Father Poverty |
| Aleuts | 35.3 /100 | #183 | Fair 16.4% |
| Cambodians | 34.6 /100 | #184 | Fair 16.4% |
| Panamanians | 33.6 /100 | #185 | Fair 16.4% |
| Immigrants | Venezuela | 31.0 /100 | #186 | Fair 16.4% |
| Ukrainians | 30.4 /100 | #187 | Fair 16.4% |
| Russians | 30.1 /100 | #188 | Fair 16.4% |
| Latvians | 28.9 /100 | #189 | Fair 16.5% |
| Immigrants | Burma/Myanmar | 28.0 /100 | #190 | Fair 16.5% |
| Immigrants | Guyana | 27.1 /100 | #191 | Fair 16.5% |
| Immigrants | Switzerland | 24.8 /100 | #192 | Fair 16.5% |
| Ecuadorians | 24.5 /100 | #193 | Fair 16.5% |
| Cape Verdeans | 24.4 /100 | #194 | Fair 16.5% |
| Immigrants | Barbados | 24.3 /100 | #195 | Fair 16.5% |
| Immigrants | Canada | 21.9 /100 | #196 | Fair 16.5% |
| Immigrants | Northern Europe | 20.3 /100 | #197 | Fair 16.5% |
Demographics Similar to Immigrants from Liberia by Single Father Poverty
In terms of single father poverty, the demographic groups most similar to Immigrants from Liberia are Hmong (15.9%, a difference of 0.010%), Iraqi (15.9%, a difference of 0.020%), Immigrants from Panama (15.9%, a difference of 0.030%), Immigrants from Nigeria (15.9%, a difference of 0.030%), and Palestinian (15.9%, a difference of 0.040%).
| Demographics | Rating | Rank | Single Father Poverty |
| Uruguayans | 92.1 /100 | #120 | Exceptional 15.9% |
| Immigrants | Immigrants | 91.9 /100 | #121 | Exceptional 15.9% |
| Sudanese | 91.6 /100 | #122 | Exceptional 15.9% |
| Palestinians | 91.3 /100 | #123 | Exceptional 15.9% |
| Immigrants | Panama | 91.3 /100 | #124 | Exceptional 15.9% |
| Iraqis | 91.2 /100 | #125 | Exceptional 15.9% |
| Hmong | 91.1 /100 | #126 | Exceptional 15.9% |
| Immigrants | Liberia | 91.1 /100 | #127 | Exceptional 15.9% |
| Immigrants | Nigeria | 90.8 /100 | #128 | Exceptional 15.9% |
| Immigrants | West Indies | 90.8 /100 | #129 | Exceptional 15.9% |
| Norwegians | 90.2 /100 | #130 | Exceptional 15.9% |
| Nicaraguans | 90.1 /100 | #131 | Exceptional 15.9% |
| Immigrants | Portugal | 89.7 /100 | #132 | Excellent 15.9% |
| Immigrants | Syria | 89.5 /100 | #133 | Excellent 15.9% |
| Immigrants | South America | 88.5 /100 | #134 | Excellent 15.9% |