Yugoslavian vs Immigrants from Kazakhstan Single Father Poverty
COMPARE
Yugoslavian
Immigrants from Kazakhstan
Single Father Poverty
Single Father Poverty Comparison
Yugoslavians
Immigrants from Kazakhstan
16.3%
SINGLE FATHER POVERTY
53.9/ 100
METRIC RATING
167th/ 347
METRIC RANK
15.6%
SINGLE FATHER POVERTY
98.2/ 100
METRIC RATING
95th/ 347
METRIC RANK
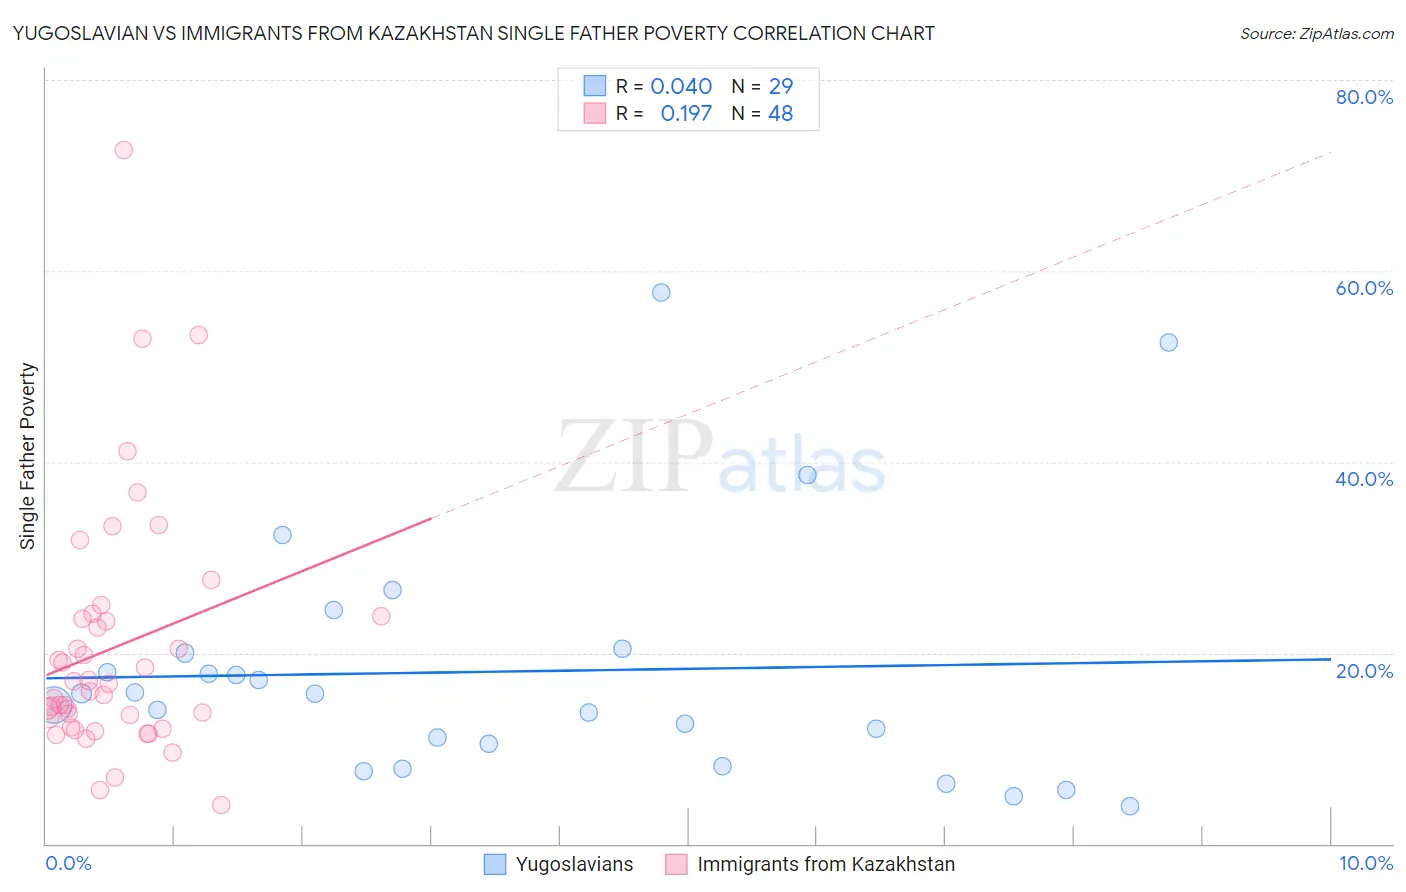
Yugoslavian vs Immigrants from Kazakhstan Single Father Poverty Correlation Chart
The statistical analysis conducted on geographies consisting of 233,019,111 people shows no correlation between the proportion of Yugoslavians and poverty level among single fathers in the United States with a correlation coefficient (R) of 0.040 and weighted average of 16.3%. Similarly, the statistical analysis conducted on geographies consisting of 108,344,450 people shows a poor positive correlation between the proportion of Immigrants from Kazakhstan and poverty level among single fathers in the United States with a correlation coefficient (R) of 0.197 and weighted average of 15.6%, a difference of 4.4%.
Single Father Poverty Correlation Summary
| Measurement | Yugoslavian | Immigrants from Kazakhstan |
| Minimum | 4.0% | 4.0% |
| Maximum | 57.7% | 72.7% |
| Range | 53.7% | 68.7% |
| Mean | 18.0% | 20.5% |
| Median | 15.7% | 16.4% |
| Interquartile 25% (IQ1) | 9.3% | 12.7% |
| Interquartile 75% (IQ3) | 20.2% | 23.7% |
| Interquartile Range (IQR) | 10.9% | 11.0% |
| Standard Deviation (Sample) | 13.0% | 13.1% |
| Standard Deviation (Population) | 12.8% | 12.9% |
Similar Demographics by Single Father Poverty
Demographics Similar to Yugoslavians by Single Father Poverty
In terms of single father poverty, the demographic groups most similar to Yugoslavians are Costa Rican (16.3%, a difference of 0.010%), Immigrants from Europe (16.3%, a difference of 0.040%), Immigrants from Bangladesh (16.3%, a difference of 0.050%), Northern European (16.3%, a difference of 0.050%), and Guyanese (16.3%, a difference of 0.060%).
| Demographics | Rating | Rank | Single Father Poverty |
| Immigrants | Sudan | 59.8 /100 | #160 | Average 16.2% |
| Estonians | 56.7 /100 | #161 | Average 16.2% |
| Ugandans | 55.9 /100 | #162 | Average 16.3% |
| Immigrants | Costa Rica | 55.7 /100 | #163 | Average 16.3% |
| Guyanese | 55.2 /100 | #164 | Average 16.3% |
| Immigrants | Bangladesh | 55.1 /100 | #165 | Average 16.3% |
| Immigrants | Europe | 54.8 /100 | #166 | Average 16.3% |
| Yugoslavians | 53.9 /100 | #167 | Average 16.3% |
| Costa Ricans | 53.6 /100 | #168 | Average 16.3% |
| Northern Europeans | 52.8 /100 | #169 | Average 16.3% |
| Scandinavians | 52.3 /100 | #170 | Average 16.3% |
| Immigrants | Morocco | 50.7 /100 | #171 | Average 16.3% |
| Immigrants | Sierra Leone | 50.1 /100 | #172 | Average 16.3% |
| Immigrants | St. Vincent and the Grenadines | 50.0 /100 | #173 | Average 16.3% |
| Swedes | 50.0 /100 | #174 | Average 16.3% |
Demographics Similar to Immigrants from Kazakhstan by Single Father Poverty
In terms of single father poverty, the demographic groups most similar to Immigrants from Kazakhstan are Immigrants from Belgium (15.6%, a difference of 0.010%), Yaqui (15.6%, a difference of 0.020%), Zimbabwean (15.6%, a difference of 0.030%), Immigrants from Uruguay (15.6%, a difference of 0.050%), and Basque (15.5%, a difference of 0.19%).
| Demographics | Rating | Rank | Single Father Poverty |
| Burmese | 99.0 /100 | #88 | Exceptional 15.5% |
| Immigrants | Korea | 99.0 /100 | #89 | Exceptional 15.5% |
| Mexican American Indians | 98.7 /100 | #90 | Exceptional 15.5% |
| Immigrants | Romania | 98.6 /100 | #91 | Exceptional 15.5% |
| Immigrants | Serbia | 98.5 /100 | #92 | Exceptional 15.5% |
| Basques | 98.4 /100 | #93 | Exceptional 15.5% |
| Immigrants | Uruguay | 98.2 /100 | #94 | Exceptional 15.6% |
| Immigrants | Kazakhstan | 98.2 /100 | #95 | Exceptional 15.6% |
| Immigrants | Belgium | 98.1 /100 | #96 | Exceptional 15.6% |
| Yaqui | 98.1 /100 | #97 | Exceptional 15.6% |
| Zimbabweans | 98.1 /100 | #98 | Exceptional 15.6% |
| Immigrants | Middle Africa | 97.4 /100 | #99 | Exceptional 15.6% |
| Immigrants | Chile | 96.9 /100 | #100 | Exceptional 15.7% |
| Fijians | 96.8 /100 | #101 | Exceptional 15.7% |
| Chileans | 96.4 /100 | #102 | Exceptional 15.7% |