Indonesian vs Danish Single Father Poverty
COMPARE
Indonesian
Danish
Single Father Poverty
Single Father Poverty Comparison
Indonesians
Danes
17.4%
SINGLE FATHER POVERTY
0.2/ 100
METRIC RATING
270th/ 347
METRIC RANK
15.8%
SINGLE FATHER POVERTY
94.5/ 100
METRIC RATING
113th/ 347
METRIC RANK
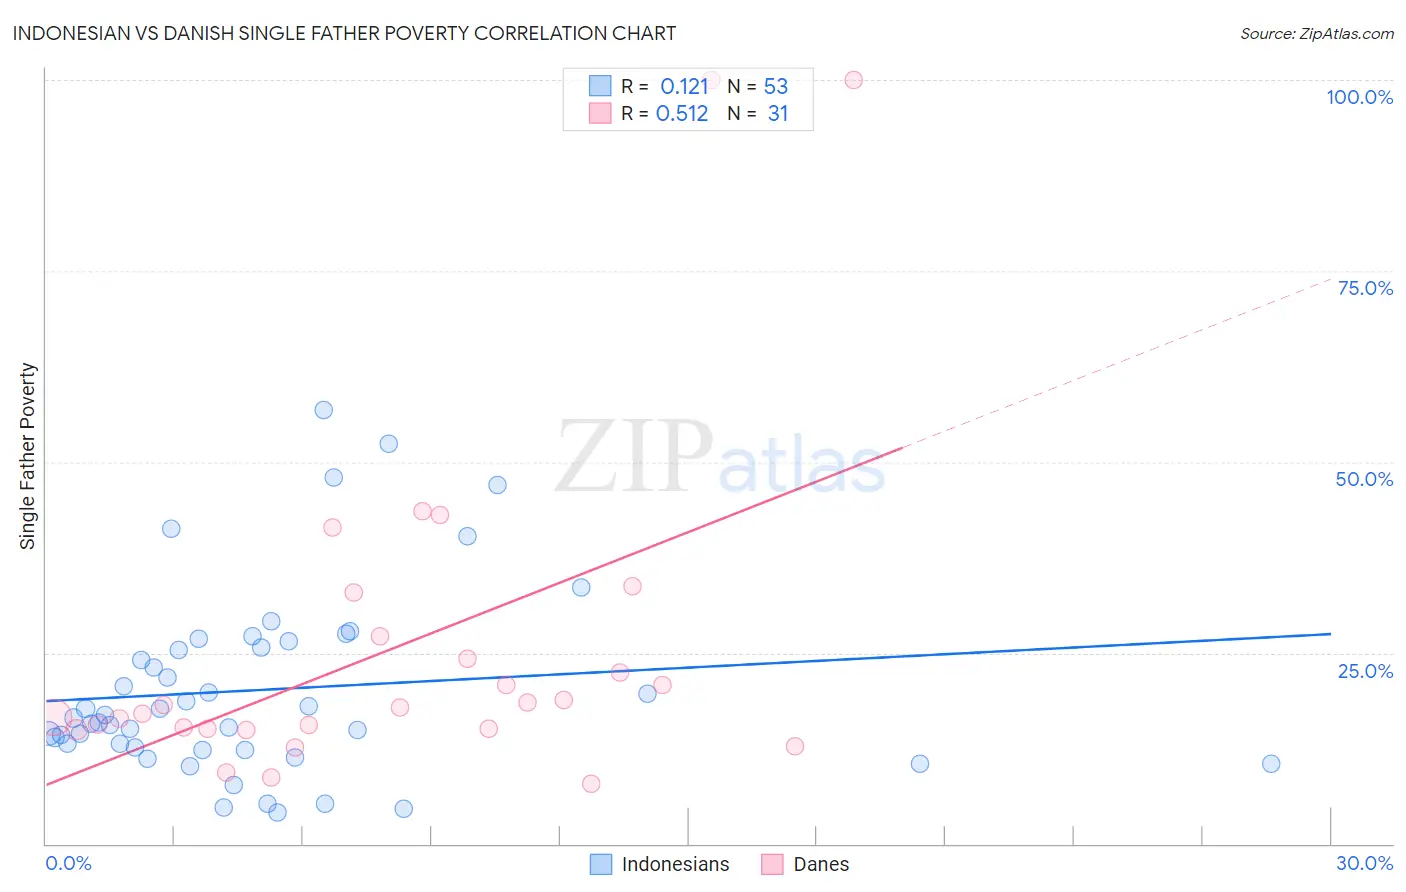
Indonesian vs Danish Single Father Poverty Correlation Chart
The statistical analysis conducted on geographies consisting of 143,522,675 people shows a poor positive correlation between the proportion of Indonesians and poverty level among single fathers in the United States with a correlation coefficient (R) of 0.121 and weighted average of 17.4%. Similarly, the statistical analysis conducted on geographies consisting of 352,960,899 people shows a substantial positive correlation between the proportion of Danes and poverty level among single fathers in the United States with a correlation coefficient (R) of 0.512 and weighted average of 15.8%, a difference of 10.3%.
Single Father Poverty Correlation Summary
| Measurement | Indonesian | Danish |
| Minimum | 4.1% | 7.9% |
| Maximum | 56.8% | 100.0% |
| Range | 52.7% | 92.1% |
| Mean | 20.1% | 25.5% |
| Median | 16.5% | 17.9% |
| Interquartile 25% (IQ1) | 12.5% | 15.1% |
| Interquartile 75% (IQ3) | 26.1% | 27.1% |
| Interquartile Range (IQR) | 13.6% | 12.0% |
| Standard Deviation (Sample) | 12.2% | 22.0% |
| Standard Deviation (Population) | 12.1% | 21.6% |
Similar Demographics by Single Father Poverty
Demographics Similar to Indonesians by Single Father Poverty
In terms of single father poverty, the demographic groups most similar to Indonesians are French American Indian (17.4%, a difference of 0.14%), Slavic (17.4%, a difference of 0.26%), Immigrants from Caribbean (17.4%, a difference of 0.33%), Haitian (17.3%, a difference of 0.43%), and Jamaican (17.3%, a difference of 0.47%).
| Demographics | Rating | Rank | Single Father Poverty |
| Lithuanians | 0.4 /100 | #263 | Tragic 17.3% |
| Slovenes | 0.3 /100 | #264 | Tragic 17.3% |
| Poles | 0.3 /100 | #265 | Tragic 17.3% |
| Jamaicans | 0.3 /100 | #266 | Tragic 17.3% |
| Haitians | 0.3 /100 | #267 | Tragic 17.3% |
| Immigrants | Caribbean | 0.3 /100 | #268 | Tragic 17.4% |
| Slavs | 0.3 /100 | #269 | Tragic 17.4% |
| Indonesians | 0.2 /100 | #270 | Tragic 17.4% |
| French American Indians | 0.2 /100 | #271 | Tragic 17.4% |
| Barbadians | 0.1 /100 | #272 | Tragic 17.5% |
| Italians | 0.1 /100 | #273 | Tragic 17.5% |
| Macedonians | 0.1 /100 | #274 | Tragic 17.7% |
| British West Indians | 0.0 /100 | #275 | Tragic 17.7% |
| German Russians | 0.0 /100 | #276 | Tragic 17.7% |
| Lebanese | 0.0 /100 | #277 | Tragic 17.7% |
Demographics Similar to Danes by Single Father Poverty
In terms of single father poverty, the demographic groups most similar to Danes are Argentinean (15.8%, a difference of 0.020%), Immigrants from Latvia (15.8%, a difference of 0.040%), Bulgarian (15.8%, a difference of 0.080%), Immigrants from Africa (15.8%, a difference of 0.13%), and Turkish (15.8%, a difference of 0.14%).
| Demographics | Rating | Rank | Single Father Poverty |
| Immigrants | Poland | 95.8 /100 | #106 | Exceptional 15.7% |
| Native Hawaiians | 95.8 /100 | #107 | Exceptional 15.7% |
| Pakistanis | 95.7 /100 | #108 | Exceptional 15.7% |
| Turks | 95.1 /100 | #109 | Exceptional 15.8% |
| Immigrants | Africa | 95.1 /100 | #110 | Exceptional 15.8% |
| Bulgarians | 94.8 /100 | #111 | Exceptional 15.8% |
| Immigrants | Latvia | 94.7 /100 | #112 | Exceptional 15.8% |
| Danes | 94.5 /100 | #113 | Exceptional 15.8% |
| Argentineans | 94.4 /100 | #114 | Exceptional 15.8% |
| Immigrants | Thailand | 93.6 /100 | #115 | Exceptional 15.8% |
| Immigrants | Argentina | 92.8 /100 | #116 | Exceptional 15.8% |
| Immigrants | Colombia | 92.6 /100 | #117 | Exceptional 15.8% |
| Immigrants | Eastern Europe | 92.5 /100 | #118 | Exceptional 15.8% |
| Immigrants | Belarus | 92.4 /100 | #119 | Exceptional 15.8% |
| Uruguayans | 92.1 /100 | #120 | Exceptional 15.9% |