Trinidadian and Tobagonian vs Cree Female Poverty
COMPARE
Trinidadian and Tobagonian
Cree
Female Poverty
Female Poverty Comparison
Trinidadians and Tobagonians
Cree
15.4%
FEMALE POVERTY
0.2/ 100
METRIC RATING
254th/ 347
METRIC RANK
15.1%
FEMALE POVERTY
0.7/ 100
METRIC RATING
236th/ 347
METRIC RANK
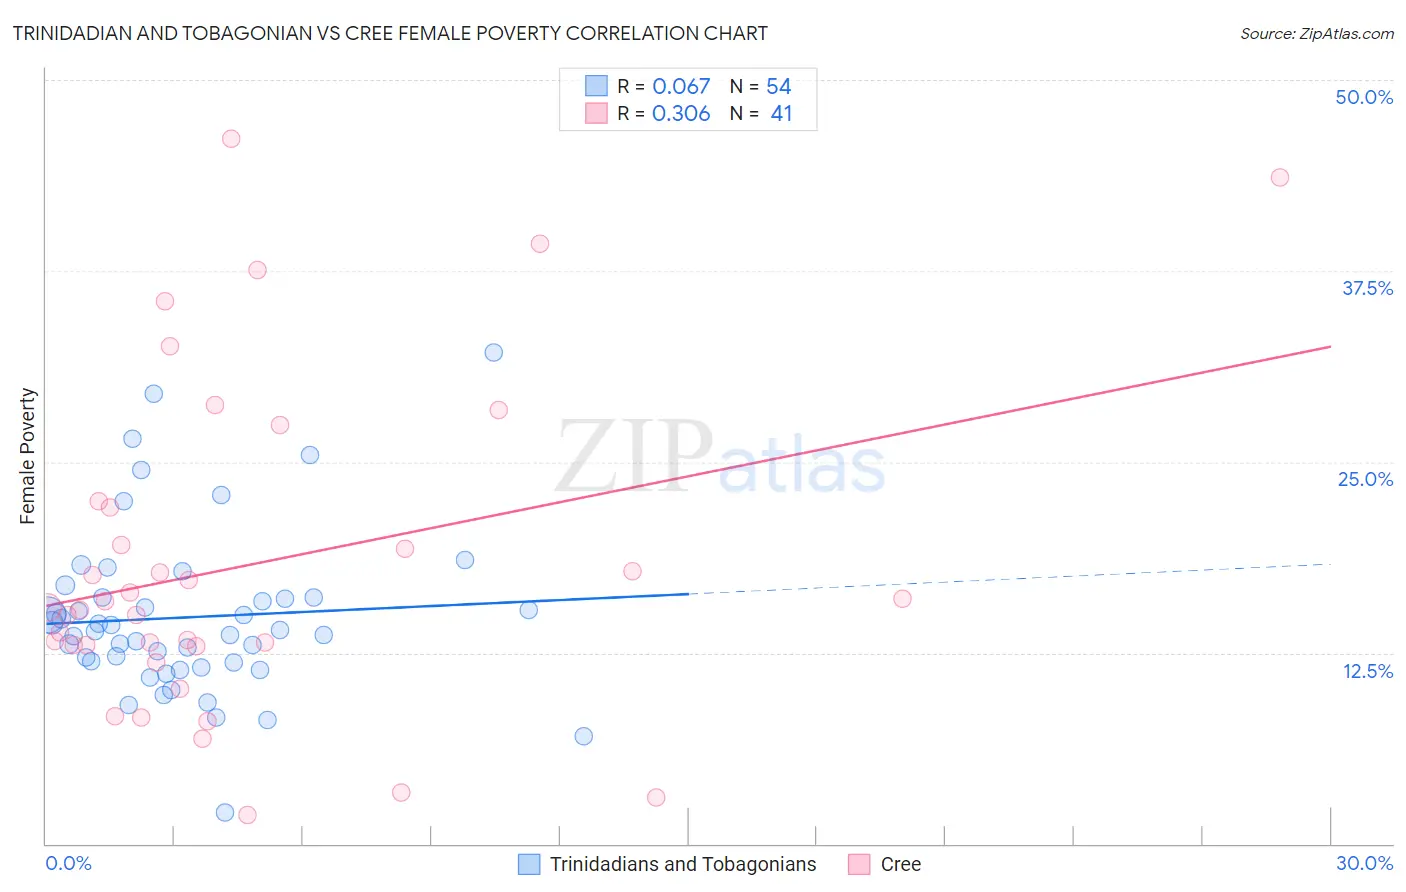
Trinidadian and Tobagonian vs Cree Female Poverty Correlation Chart
The statistical analysis conducted on geographies consisting of 219,692,358 people shows a slight positive correlation between the proportion of Trinidadians and Tobagonians and poverty level among females in the United States with a correlation coefficient (R) of 0.067 and weighted average of 15.4%. Similarly, the statistical analysis conducted on geographies consisting of 76,205,859 people shows a mild positive correlation between the proportion of Cree and poverty level among females in the United States with a correlation coefficient (R) of 0.306 and weighted average of 15.1%, a difference of 2.6%.
Female Poverty Correlation Summary
| Measurement | Trinidadian and Tobagonian | Cree |
| Minimum | 2.0% | 1.9% |
| Maximum | 32.1% | 46.1% |
| Range | 30.1% | 44.3% |
| Mean | 14.8% | 18.3% |
| Median | 13.9% | 15.5% |
| Interquartile 25% (IQ1) | 11.9% | 13.0% |
| Interquartile 75% (IQ3) | 16.1% | 22.2% |
| Interquartile Range (IQR) | 4.2% | 9.2% |
| Standard Deviation (Sample) | 5.5% | 10.7% |
| Standard Deviation (Population) | 5.4% | 10.6% |
Demographics Similar to Trinidadians and Tobagonians and Cree by Female Poverty
In terms of female poverty, the demographic groups most similar to Trinidadians and Tobagonians are Liberian (15.4%, a difference of 0.24%), Ottawa (15.5%, a difference of 0.31%), Immigrants from Burma/Myanmar (15.4%, a difference of 0.50%), Immigrants from Trinidad and Tobago (15.4%, a difference of 0.53%), and Immigrants from Western Africa (15.3%, a difference of 0.69%). Similarly, the demographic groups most similar to Cree are French American Indian (15.1%, a difference of 0.19%), Immigrants from Armenia (15.1%, a difference of 0.26%), Immigrants from Laos (15.0%, a difference of 0.63%), Immigrants from Middle Africa (15.2%, a difference of 0.78%), and Sudanese (15.2%, a difference of 0.84%).
| Demographics | Rating | Rank | Female Poverty |
| Immigrants | Laos | 0.9 /100 | #235 | Tragic 15.0% |
| Cree | 0.7 /100 | #236 | Tragic 15.1% |
| French American Indians | 0.6 /100 | #237 | Tragic 15.1% |
| Immigrants | Armenia | 0.6 /100 | #238 | Tragic 15.1% |
| Immigrants | Middle Africa | 0.5 /100 | #239 | Tragic 15.2% |
| Sudanese | 0.5 /100 | #240 | Tragic 15.2% |
| Immigrants | Sudan | 0.4 /100 | #241 | Tragic 15.2% |
| Nepalese | 0.4 /100 | #242 | Tragic 15.2% |
| Nicaraguans | 0.3 /100 | #243 | Tragic 15.3% |
| Ecuadorians | 0.3 /100 | #244 | Tragic 15.3% |
| Spanish American Indians | 0.3 /100 | #245 | Tragic 15.3% |
| Cubans | 0.3 /100 | #246 | Tragic 15.3% |
| Potawatomi | 0.3 /100 | #247 | Tragic 15.3% |
| Immigrants | Ghana | 0.3 /100 | #248 | Tragic 15.3% |
| Salvadorans | 0.3 /100 | #249 | Tragic 15.3% |
| Immigrants | Western Africa | 0.3 /100 | #250 | Tragic 15.3% |
| Immigrants | Trinidad and Tobago | 0.3 /100 | #251 | Tragic 15.4% |
| Immigrants | Burma/Myanmar | 0.3 /100 | #252 | Tragic 15.4% |
| Liberians | 0.2 /100 | #253 | Tragic 15.4% |
| Trinidadians and Tobagonians | 0.2 /100 | #254 | Tragic 15.4% |
| Ottawa | 0.2 /100 | #255 | Tragic 15.5% |