Trinidadian and Tobagonian vs Japanese Poverty
COMPARE
Trinidadian and Tobagonian
Japanese
Poverty
Poverty Comparison
Trinidadians and Tobagonians
Japanese
14.3%
POVERTY
0.1/ 100
METRIC RATING
257th/ 347
METRIC RANK
13.3%
POVERTY
3.3/ 100
METRIC RATING
215th/ 347
METRIC RANK
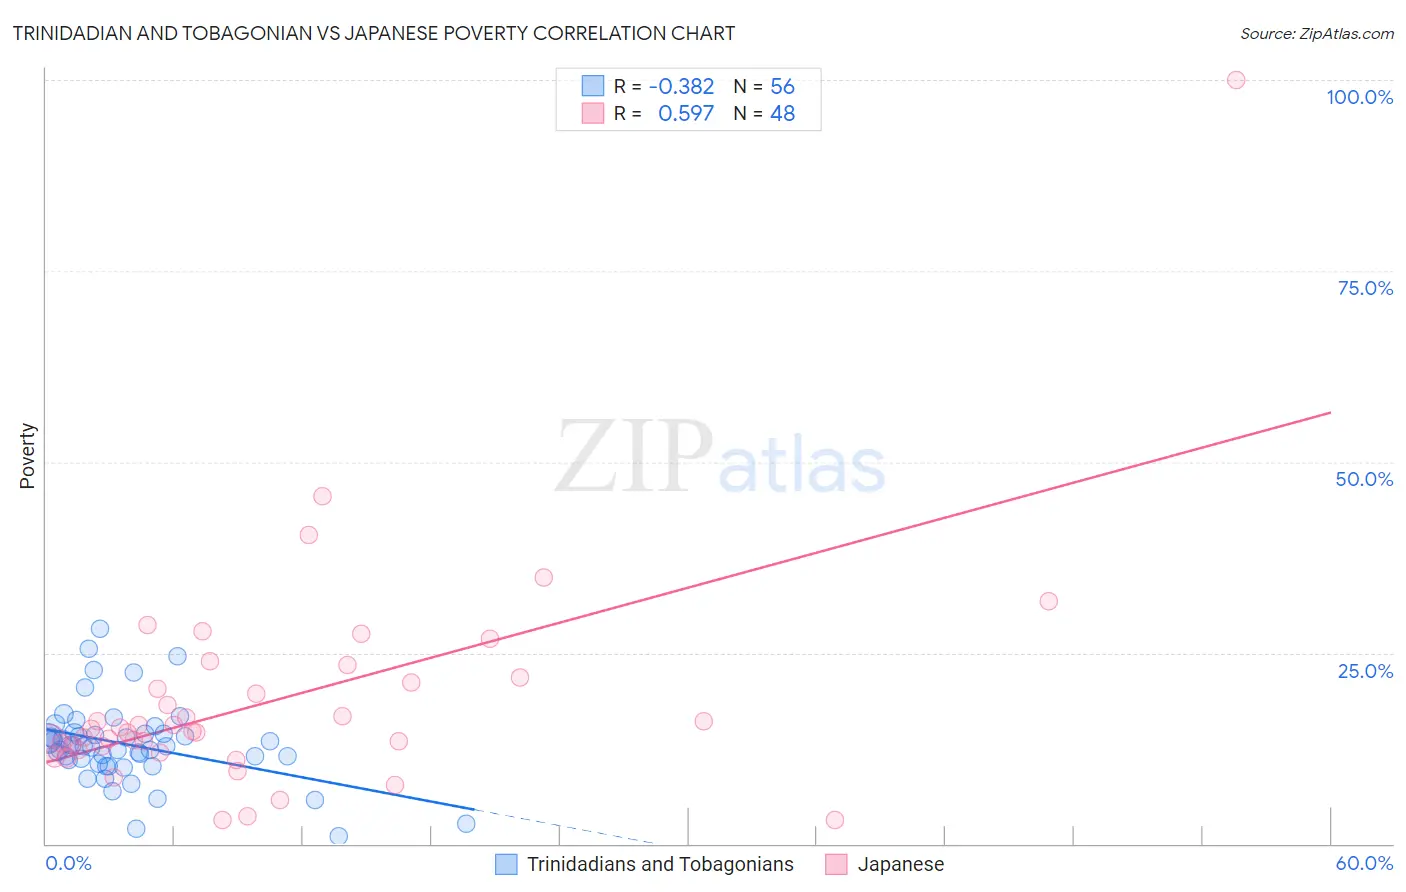
Trinidadian and Tobagonian vs Japanese Poverty Correlation Chart
The statistical analysis conducted on geographies consisting of 219,718,536 people shows a mild negative correlation between the proportion of Trinidadians and Tobagonians and poverty level in the United States with a correlation coefficient (R) of -0.382 and weighted average of 14.3%. Similarly, the statistical analysis conducted on geographies consisting of 249,091,915 people shows a substantial positive correlation between the proportion of Japanese and poverty level in the United States with a correlation coefficient (R) of 0.597 and weighted average of 13.3%, a difference of 7.3%.
Poverty Correlation Summary
| Measurement | Trinidadian and Tobagonian | Japanese |
| Minimum | 1.0% | 3.1% |
| Maximum | 28.1% | 100.0% |
| Range | 27.1% | 96.9% |
| Mean | 13.0% | 18.8% |
| Median | 12.8% | 14.9% |
| Interquartile 25% (IQ1) | 10.7% | 12.5% |
| Interquartile 75% (IQ3) | 14.4% | 21.4% |
| Interquartile Range (IQR) | 3.7% | 8.9% |
| Standard Deviation (Sample) | 5.2% | 14.9% |
| Standard Deviation (Population) | 5.1% | 14.8% |
Similar Demographics by Poverty
Demographics Similar to Trinidadians and Tobagonians by Poverty
In terms of poverty, the demographic groups most similar to Trinidadians and Tobagonians are Ottawa (14.3%, a difference of 0.010%), Mexican American Indian (14.3%, a difference of 0.040%), Immigrants from Ecuador (14.3%, a difference of 0.060%), Immigrants from El Salvador (14.3%, a difference of 0.16%), and Immigrants from Nicaragua (14.3%, a difference of 0.28%).
| Demographics | Rating | Rank | Poverty |
| Cree | 0.2 /100 | #250 | Tragic 14.2% |
| Immigrants | Burma/Myanmar | 0.2 /100 | #251 | Tragic 14.2% |
| Spanish American Indians | 0.2 /100 | #252 | Tragic 14.2% |
| Immigrants | Trinidad and Tobago | 0.2 /100 | #253 | Tragic 14.2% |
| Immigrants | El Salvador | 0.1 /100 | #254 | Tragic 14.3% |
| Immigrants | Ecuador | 0.1 /100 | #255 | Tragic 14.3% |
| Mexican American Indians | 0.1 /100 | #256 | Tragic 14.3% |
| Trinidadians and Tobagonians | 0.1 /100 | #257 | Tragic 14.3% |
| Ottawa | 0.1 /100 | #258 | Tragic 14.3% |
| Immigrants | Nicaragua | 0.1 /100 | #259 | Tragic 14.3% |
| Cape Verdeans | 0.1 /100 | #260 | Tragic 14.4% |
| Cherokee | 0.1 /100 | #261 | Tragic 14.4% |
| Immigrants | Liberia | 0.1 /100 | #262 | Tragic 14.4% |
| Jamaicans | 0.1 /100 | #263 | Tragic 14.4% |
| Immigrants | Jamaica | 0.1 /100 | #264 | Tragic 14.4% |
Demographics Similar to Japanese by Poverty
In terms of poverty, the demographic groups most similar to Japanese are Nonimmigrants (13.3%, a difference of 0.0%), Immigrants from Uzbekistan (13.3%, a difference of 0.040%), Immigrants from Thailand (13.3%, a difference of 0.10%), Immigrants from Cambodia (13.4%, a difference of 0.23%), and Bermudan (13.3%, a difference of 0.26%).
| Demographics | Rating | Rank | Poverty |
| Ugandans | 6.2 /100 | #208 | Tragic 13.1% |
| Malaysians | 6.1 /100 | #209 | Tragic 13.1% |
| Immigrants | Azores | 6.1 /100 | #210 | Tragic 13.1% |
| Moroccans | 5.2 /100 | #211 | Tragic 13.2% |
| Immigrants | Immigrants | 4.3 /100 | #212 | Tragic 13.2% |
| Immigrants | Panama | 4.1 /100 | #213 | Tragic 13.3% |
| Bermudans | 3.7 /100 | #214 | Tragic 13.3% |
| Japanese | 3.3 /100 | #215 | Tragic 13.3% |
| Immigrants | Nonimmigrants | 3.3 /100 | #216 | Tragic 13.3% |
| Immigrants | Uzbekistan | 3.2 /100 | #217 | Tragic 13.3% |
| Immigrants | Thailand | 3.1 /100 | #218 | Tragic 13.3% |
| Immigrants | Cambodia | 3.0 /100 | #219 | Tragic 13.4% |
| Americans | 2.9 /100 | #220 | Tragic 13.4% |
| Alsatians | 2.6 /100 | #221 | Tragic 13.4% |
| Immigrants | Micronesia | 2.6 /100 | #222 | Tragic 13.4% |