Trinidadian and Tobagonian vs Immigrants from Venezuela Poverty
COMPARE
Trinidadian and Tobagonian
Immigrants from Venezuela
Poverty
Poverty Comparison
Trinidadians and Tobagonians
Immigrants from Venezuela
14.3%
POVERTY
0.1/ 100
METRIC RATING
257th/ 347
METRIC RANK
12.2%
POVERTY
56.5/ 100
METRIC RATING
168th/ 347
METRIC RANK
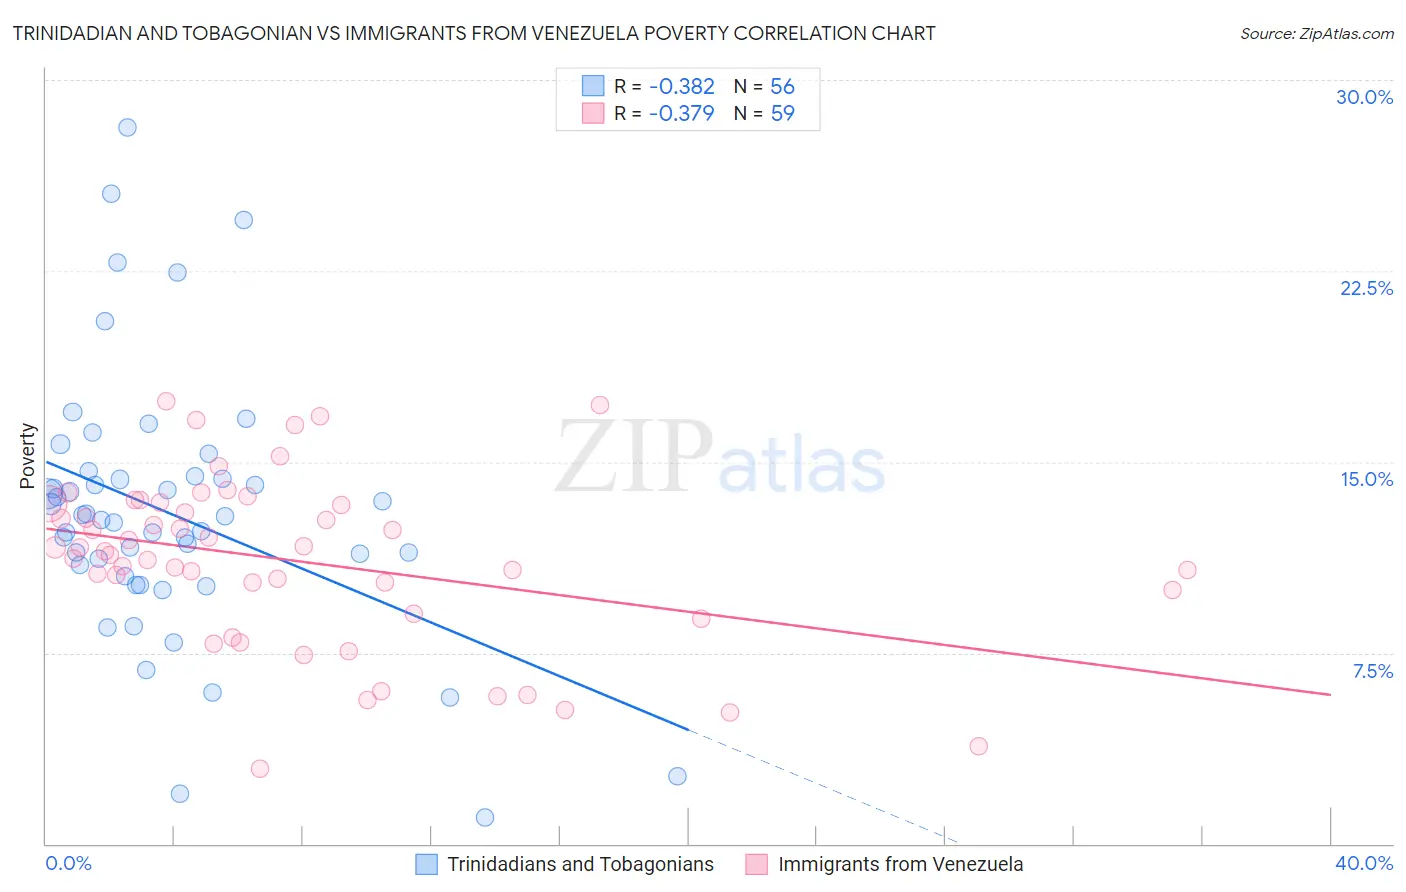
Trinidadian and Tobagonian vs Immigrants from Venezuela Poverty Correlation Chart
The statistical analysis conducted on geographies consisting of 219,718,536 people shows a mild negative correlation between the proportion of Trinidadians and Tobagonians and poverty level in the United States with a correlation coefficient (R) of -0.382 and weighted average of 14.3%. Similarly, the statistical analysis conducted on geographies consisting of 287,661,390 people shows a mild negative correlation between the proportion of Immigrants from Venezuela and poverty level in the United States with a correlation coefficient (R) of -0.379 and weighted average of 12.2%, a difference of 16.8%.
Poverty Correlation Summary
| Measurement | Trinidadian and Tobagonian | Immigrants from Venezuela |
| Minimum | 1.0% | 2.9% |
| Maximum | 28.1% | 17.4% |
| Range | 27.1% | 14.5% |
| Mean | 13.0% | 11.1% |
| Median | 12.8% | 11.5% |
| Interquartile 25% (IQ1) | 10.7% | 9.0% |
| Interquartile 75% (IQ3) | 14.4% | 13.4% |
| Interquartile Range (IQR) | 3.7% | 4.3% |
| Standard Deviation (Sample) | 5.2% | 3.3% |
| Standard Deviation (Population) | 5.1% | 3.3% |
Similar Demographics by Poverty
Demographics Similar to Trinidadians and Tobagonians by Poverty
In terms of poverty, the demographic groups most similar to Trinidadians and Tobagonians are Ottawa (14.3%, a difference of 0.010%), Mexican American Indian (14.3%, a difference of 0.040%), Immigrants from Ecuador (14.3%, a difference of 0.060%), Immigrants from El Salvador (14.3%, a difference of 0.16%), and Immigrants from Nicaragua (14.3%, a difference of 0.28%).
| Demographics | Rating | Rank | Poverty |
| Cree | 0.2 /100 | #250 | Tragic 14.2% |
| Immigrants | Burma/Myanmar | 0.2 /100 | #251 | Tragic 14.2% |
| Spanish American Indians | 0.2 /100 | #252 | Tragic 14.2% |
| Immigrants | Trinidad and Tobago | 0.2 /100 | #253 | Tragic 14.2% |
| Immigrants | El Salvador | 0.1 /100 | #254 | Tragic 14.3% |
| Immigrants | Ecuador | 0.1 /100 | #255 | Tragic 14.3% |
| Mexican American Indians | 0.1 /100 | #256 | Tragic 14.3% |
| Trinidadians and Tobagonians | 0.1 /100 | #257 | Tragic 14.3% |
| Ottawa | 0.1 /100 | #258 | Tragic 14.3% |
| Immigrants | Nicaragua | 0.1 /100 | #259 | Tragic 14.3% |
| Cape Verdeans | 0.1 /100 | #260 | Tragic 14.4% |
| Cherokee | 0.1 /100 | #261 | Tragic 14.4% |
| Immigrants | Liberia | 0.1 /100 | #262 | Tragic 14.4% |
| Jamaicans | 0.1 /100 | #263 | Tragic 14.4% |
| Immigrants | Jamaica | 0.1 /100 | #264 | Tragic 14.4% |
Demographics Similar to Immigrants from Venezuela by Poverty
In terms of poverty, the demographic groups most similar to Immigrants from Venezuela are Immigrants from Chile (12.2%, a difference of 0.020%), Venezuelan (12.2%, a difference of 0.040%), White/Caucasian (12.3%, a difference of 0.11%), Immigrants from Albania (12.2%, a difference of 0.12%), and Colombian (12.2%, a difference of 0.13%).
| Demographics | Rating | Rank | Poverty |
| Immigrants | Fiji | 59.1 /100 | #161 | Average 12.2% |
| Ethiopians | 59.1 /100 | #162 | Average 12.2% |
| Immigrants | Ethiopia | 58.6 /100 | #163 | Average 12.2% |
| Colombians | 57.8 /100 | #164 | Average 12.2% |
| Immigrants | Albania | 57.7 /100 | #165 | Average 12.2% |
| Venezuelans | 56.9 /100 | #166 | Average 12.2% |
| Immigrants | Chile | 56.7 /100 | #167 | Average 12.2% |
| Immigrants | Venezuela | 56.5 /100 | #168 | Average 12.2% |
| Whites/Caucasians | 55.4 /100 | #169 | Average 12.3% |
| Immigrants | Oceania | 54.6 /100 | #170 | Average 12.3% |
| Immigrants | Spain | 51.3 /100 | #171 | Average 12.3% |
| Immigrants | Portugal | 50.5 /100 | #172 | Average 12.3% |
| Celtics | 50.1 /100 | #173 | Average 12.3% |
| Lebanese | 50.0 /100 | #174 | Average 12.3% |
| South Americans | 48.7 /100 | #175 | Average 12.3% |