Trinidadian and Tobagonian vs Polish Poverty
COMPARE
Trinidadian and Tobagonian
Polish
Poverty
Poverty Comparison
Trinidadians and Tobagonians
Poles
14.3%
POVERTY
0.1/ 100
METRIC RATING
257th/ 347
METRIC RANK
10.7%
POVERTY
99.5/ 100
METRIC RATING
31st/ 347
METRIC RANK
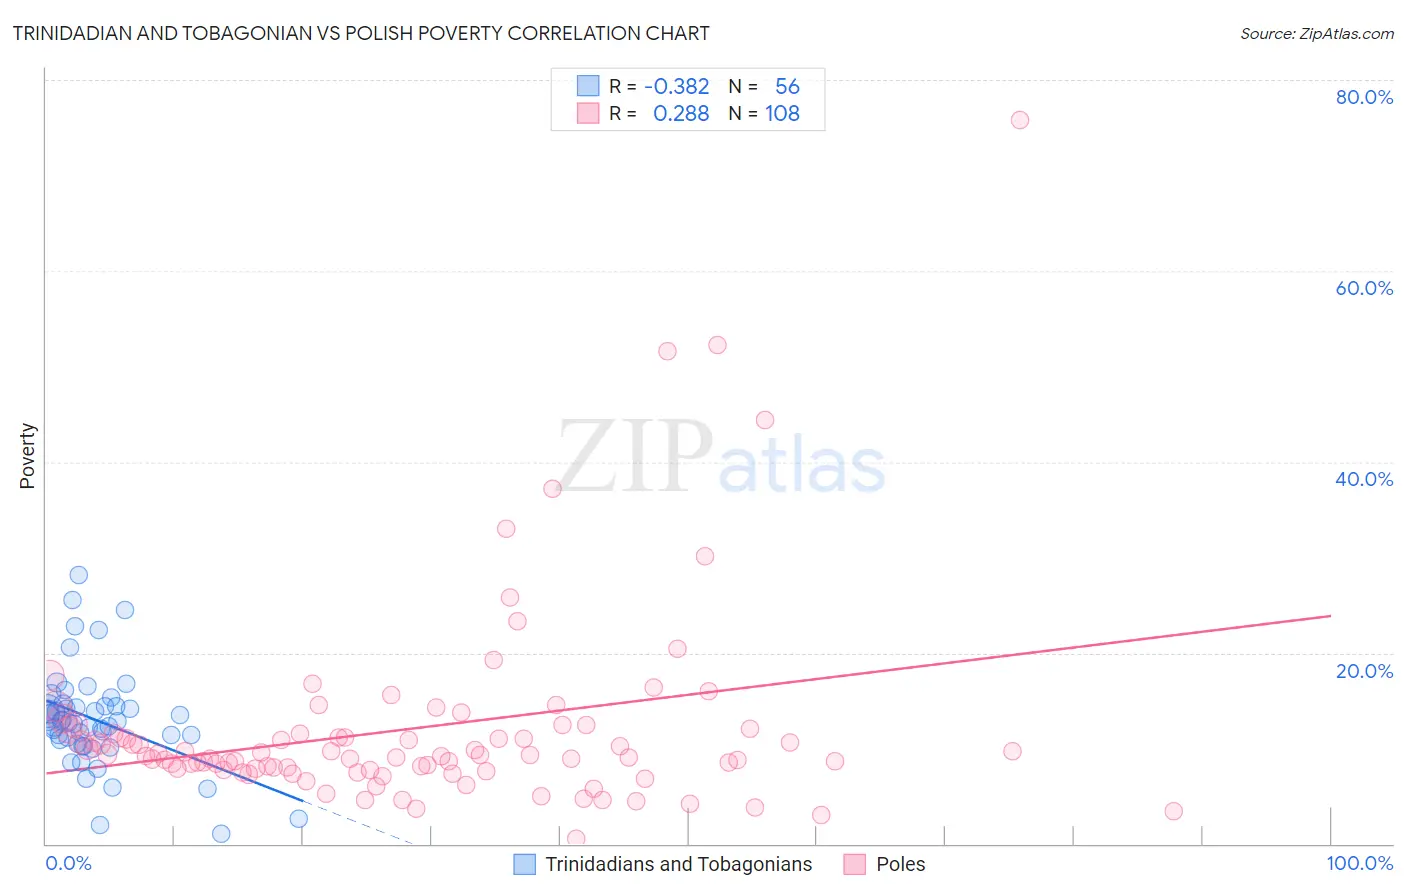
Trinidadian and Tobagonian vs Polish Poverty Correlation Chart
The statistical analysis conducted on geographies consisting of 219,718,536 people shows a mild negative correlation between the proportion of Trinidadians and Tobagonians and poverty level in the United States with a correlation coefficient (R) of -0.382 and weighted average of 14.3%. Similarly, the statistical analysis conducted on geographies consisting of 559,734,720 people shows a weak positive correlation between the proportion of Poles and poverty level in the United States with a correlation coefficient (R) of 0.288 and weighted average of 10.7%, a difference of 33.2%.
Poverty Correlation Summary
| Measurement | Trinidadian and Tobagonian | Polish |
| Minimum | 1.0% | 0.55% |
| Maximum | 28.1% | 75.7% |
| Range | 27.1% | 75.2% |
| Mean | 13.0% | 12.1% |
| Median | 12.8% | 9.2% |
| Interquartile 25% (IQ1) | 10.7% | 7.8% |
| Interquartile 75% (IQ3) | 14.4% | 11.7% |
| Interquartile Range (IQR) | 3.7% | 3.9% |
| Standard Deviation (Sample) | 5.2% | 10.5% |
| Standard Deviation (Population) | 5.1% | 10.5% |
Similar Demographics by Poverty
Demographics Similar to Trinidadians and Tobagonians by Poverty
In terms of poverty, the demographic groups most similar to Trinidadians and Tobagonians are Ottawa (14.3%, a difference of 0.010%), Mexican American Indian (14.3%, a difference of 0.040%), Immigrants from Ecuador (14.3%, a difference of 0.060%), Immigrants from El Salvador (14.3%, a difference of 0.16%), and Immigrants from Nicaragua (14.3%, a difference of 0.28%).
| Demographics | Rating | Rank | Poverty |
| Cree | 0.2 /100 | #250 | Tragic 14.2% |
| Immigrants | Burma/Myanmar | 0.2 /100 | #251 | Tragic 14.2% |
| Spanish American Indians | 0.2 /100 | #252 | Tragic 14.2% |
| Immigrants | Trinidad and Tobago | 0.2 /100 | #253 | Tragic 14.2% |
| Immigrants | El Salvador | 0.1 /100 | #254 | Tragic 14.3% |
| Immigrants | Ecuador | 0.1 /100 | #255 | Tragic 14.3% |
| Mexican American Indians | 0.1 /100 | #256 | Tragic 14.3% |
| Trinidadians and Tobagonians | 0.1 /100 | #257 | Tragic 14.3% |
| Ottawa | 0.1 /100 | #258 | Tragic 14.3% |
| Immigrants | Nicaragua | 0.1 /100 | #259 | Tragic 14.3% |
| Cape Verdeans | 0.1 /100 | #260 | Tragic 14.4% |
| Cherokee | 0.1 /100 | #261 | Tragic 14.4% |
| Immigrants | Liberia | 0.1 /100 | #262 | Tragic 14.4% |
| Jamaicans | 0.1 /100 | #263 | Tragic 14.4% |
| Immigrants | Jamaica | 0.1 /100 | #264 | Tragic 14.4% |
Demographics Similar to Poles by Poverty
In terms of poverty, the demographic groups most similar to Poles are Danish (10.7%, a difference of 0.080%), Greek (10.7%, a difference of 0.090%), Iranian (10.7%, a difference of 0.090%), Immigrants from Korea (10.7%, a difference of 0.19%), and Immigrants from Northern Europe (10.7%, a difference of 0.25%).
| Demographics | Rating | Rank | Poverty |
| Italians | 99.7 /100 | #24 | Exceptional 10.6% |
| Croatians | 99.6 /100 | #25 | Exceptional 10.6% |
| Burmese | 99.6 /100 | #26 | Exceptional 10.7% |
| Immigrants | Northern Europe | 99.6 /100 | #27 | Exceptional 10.7% |
| Immigrants | Korea | 99.5 /100 | #28 | Exceptional 10.7% |
| Greeks | 99.5 /100 | #29 | Exceptional 10.7% |
| Danes | 99.5 /100 | #30 | Exceptional 10.7% |
| Poles | 99.5 /100 | #31 | Exceptional 10.7% |
| Iranians | 99.5 /100 | #32 | Exceptional 10.7% |
| Macedonians | 99.4 /100 | #33 | Exceptional 10.8% |
| Immigrants | Poland | 99.4 /100 | #34 | Exceptional 10.8% |
| Tongans | 99.4 /100 | #35 | Exceptional 10.8% |
| Cypriots | 99.3 /100 | #36 | Exceptional 10.8% |
| Immigrants | Greece | 99.3 /100 | #37 | Exceptional 10.8% |
| Czechs | 99.3 /100 | #38 | Exceptional 10.8% |