Brazilian vs Welsh Single Father Poverty
COMPARE
Brazilian
Welsh
Single Father Poverty
Single Father Poverty Comparison
Brazilians
Welsh
15.5%
SINGLE FATHER POVERTY
99.0/ 100
METRIC RATING
87th/ 347
METRIC RANK
17.8%
SINGLE FATHER POVERTY
0.0/ 100
METRIC RATING
284th/ 347
METRIC RANK
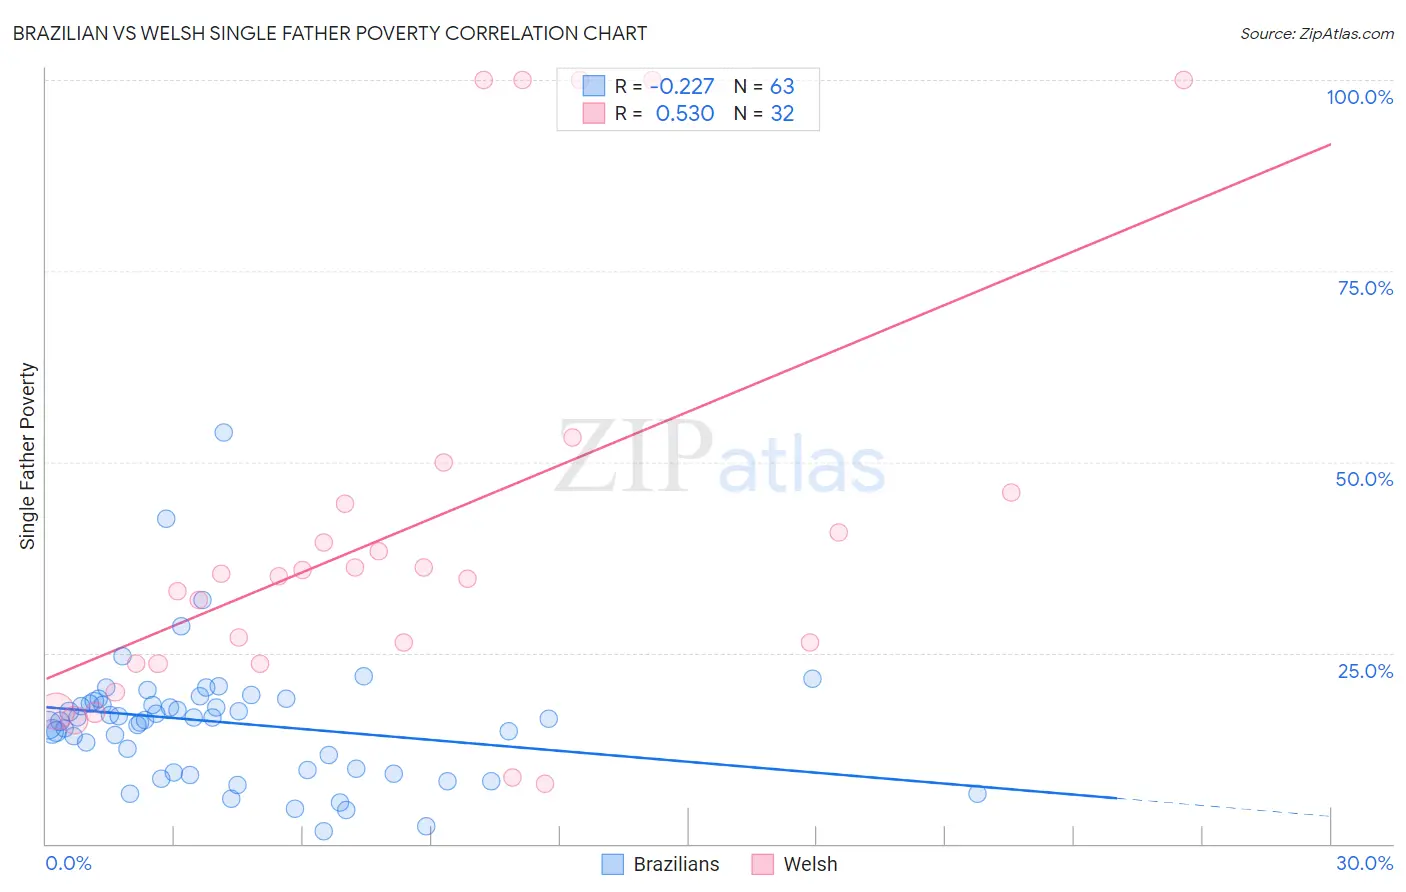
Brazilian vs Welsh Single Father Poverty Correlation Chart
The statistical analysis conducted on geographies consisting of 259,661,498 people shows a weak negative correlation between the proportion of Brazilians and poverty level among single fathers in the United States with a correlation coefficient (R) of -0.227 and weighted average of 15.5%. Similarly, the statistical analysis conducted on geographies consisting of 385,351,851 people shows a substantial positive correlation between the proportion of Welsh and poverty level among single fathers in the United States with a correlation coefficient (R) of 0.530 and weighted average of 17.8%, a difference of 15.3%.
Single Father Poverty Correlation Summary
| Measurement | Brazilian | Welsh |
| Minimum | 1.7% | 7.8% |
| Maximum | 53.9% | 100.0% |
| Range | 52.2% | 92.2% |
| Mean | 15.9% | 41.5% |
| Median | 16.4% | 35.2% |
| Interquartile 25% (IQ1) | 9.6% | 23.6% |
| Interquartile 75% (IQ3) | 18.7% | 45.3% |
| Interquartile Range (IQR) | 9.1% | 21.7% |
| Standard Deviation (Sample) | 8.4% | 27.8% |
| Standard Deviation (Population) | 8.4% | 27.3% |
Similar Demographics by Single Father Poverty
Demographics Similar to Brazilians by Single Father Poverty
In terms of single father poverty, the demographic groups most similar to Brazilians are Immigrants from Russia (15.5%, a difference of 0.0%), Burmese (15.5%, a difference of 0.030%), Immigrants from Korea (15.5%, a difference of 0.090%), Immigrants from Oceania (15.4%, a difference of 0.13%), and Peruvian (15.4%, a difference of 0.24%).
| Demographics | Rating | Rank | Single Father Poverty |
| Armenians | 99.4 /100 | #80 | Exceptional 15.4% |
| Immigrants | Congo | 99.4 /100 | #81 | Exceptional 15.4% |
| Immigrants | Ukraine | 99.4 /100 | #82 | Exceptional 15.4% |
| Chinese | 99.3 /100 | #83 | Exceptional 15.4% |
| Peruvians | 99.2 /100 | #84 | Exceptional 15.4% |
| Immigrants | Oceania | 99.1 /100 | #85 | Exceptional 15.4% |
| Immigrants | Russia | 99.0 /100 | #86 | Exceptional 15.5% |
| Brazilians | 99.0 /100 | #87 | Exceptional 15.5% |
| Burmese | 99.0 /100 | #88 | Exceptional 15.5% |
| Immigrants | Korea | 99.0 /100 | #89 | Exceptional 15.5% |
| Mexican American Indians | 98.7 /100 | #90 | Exceptional 15.5% |
| Immigrants | Romania | 98.6 /100 | #91 | Exceptional 15.5% |
| Immigrants | Serbia | 98.5 /100 | #92 | Exceptional 15.5% |
| Basques | 98.4 /100 | #93 | Exceptional 15.5% |
| Immigrants | Uruguay | 98.2 /100 | #94 | Exceptional 15.6% |
Demographics Similar to Welsh by Single Father Poverty
In terms of single father poverty, the demographic groups most similar to Welsh are Alsatian (17.8%, a difference of 0.020%), Dutch (17.8%, a difference of 0.11%), English (17.8%, a difference of 0.12%), Immigrants from Lebanon (17.9%, a difference of 0.37%), and Scottish (17.7%, a difference of 0.43%).
| Demographics | Rating | Rank | Single Father Poverty |
| Lebanese | 0.0 /100 | #277 | Tragic 17.7% |
| Germans | 0.0 /100 | #278 | Tragic 17.7% |
| Iroquois | 0.0 /100 | #279 | Tragic 17.7% |
| Scottish | 0.0 /100 | #280 | Tragic 17.7% |
| English | 0.0 /100 | #281 | Tragic 17.8% |
| Dutch | 0.0 /100 | #282 | Tragic 17.8% |
| Alsatians | 0.0 /100 | #283 | Tragic 17.8% |
| Welsh | 0.0 /100 | #284 | Tragic 17.8% |
| Immigrants | Lebanon | 0.0 /100 | #285 | Tragic 17.9% |
| Immigrants | North Macedonia | 0.0 /100 | #286 | Tragic 17.9% |
| Carpatho Rusyns | 0.0 /100 | #287 | Tragic 18.0% |
| Bahamians | 0.0 /100 | #288 | Tragic 18.0% |
| Irish | 0.0 /100 | #289 | Tragic 18.0% |
| West Indians | 0.0 /100 | #290 | Tragic 18.0% |
| Alaskan Athabascans | 0.0 /100 | #291 | Tragic 18.1% |