Comanche vs Welsh Single Father Poverty
COMPARE
Comanche
Welsh
Single Father Poverty
Single Father Poverty Comparison
Comanche
Welsh
18.5%
SINGLE FATHER POVERTY
0.0/ 100
METRIC RATING
302nd/ 347
METRIC RANK
17.8%
SINGLE FATHER POVERTY
0.0/ 100
METRIC RATING
284th/ 347
METRIC RANK
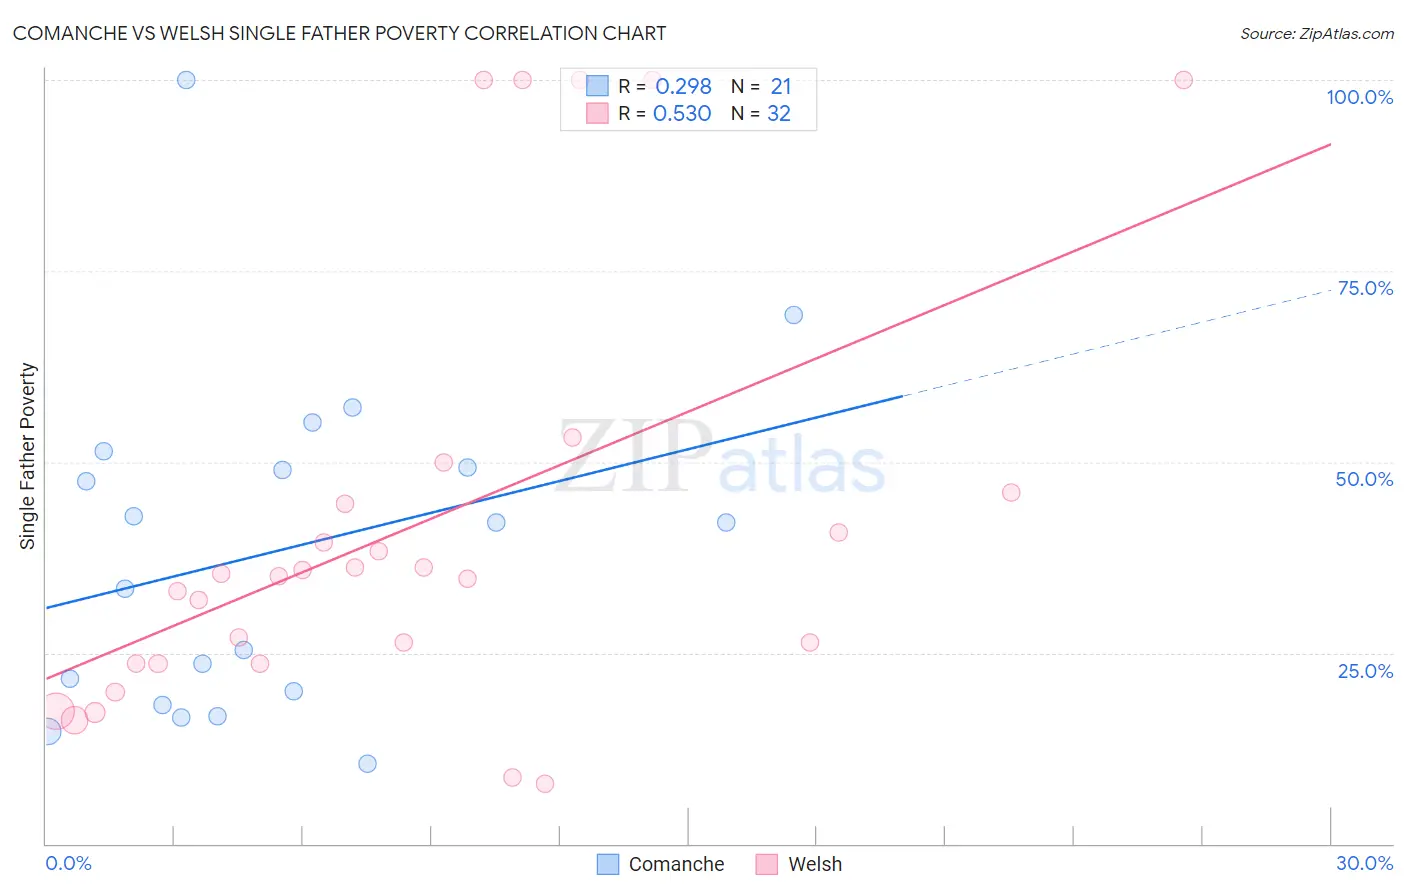
Comanche vs Welsh Single Father Poverty Correlation Chart
The statistical analysis conducted on geographies consisting of 100,339,334 people shows a weak positive correlation between the proportion of Comanche and poverty level among single fathers in the United States with a correlation coefficient (R) of 0.298 and weighted average of 18.5%. Similarly, the statistical analysis conducted on geographies consisting of 385,351,851 people shows a substantial positive correlation between the proportion of Welsh and poverty level among single fathers in the United States with a correlation coefficient (R) of 0.530 and weighted average of 17.8%, a difference of 3.7%.
Single Father Poverty Correlation Summary
| Measurement | Comanche | Welsh |
| Minimum | 10.5% | 7.8% |
| Maximum | 100.0% | 100.0% |
| Range | 89.5% | 92.2% |
| Mean | 38.4% | 41.5% |
| Median | 42.1% | 35.2% |
| Interquartile 25% (IQ1) | 19.1% | 23.6% |
| Interquartile 75% (IQ3) | 50.3% | 45.3% |
| Interquartile Range (IQR) | 31.2% | 21.7% |
| Standard Deviation (Sample) | 21.9% | 27.8% |
| Standard Deviation (Population) | 21.4% | 27.3% |
Demographics Similar to Comanche and Welsh by Single Father Poverty
In terms of single father poverty, the demographic groups most similar to Comanche are Celtic (18.5%, a difference of 0.040%), Hungarian (18.5%, a difference of 0.11%), Immigrants from Dominican Republic (18.4%, a difference of 0.32%), White/Caucasian (18.4%, a difference of 0.64%), and African (18.3%, a difference of 0.86%). Similarly, the demographic groups most similar to Welsh are Alsatian (17.8%, a difference of 0.020%), Immigrants from Lebanon (17.9%, a difference of 0.37%), Immigrants from North Macedonia (17.9%, a difference of 0.55%), Carpatho Rusyn (18.0%, a difference of 0.77%), and Bahamian (18.0%, a difference of 0.79%).
| Demographics | Rating | Rank | Single Father Poverty |
| Alsatians | 0.0 /100 | #283 | Tragic 17.8% |
| Welsh | 0.0 /100 | #284 | Tragic 17.8% |
| Immigrants | Lebanon | 0.0 /100 | #285 | Tragic 17.9% |
| Immigrants | North Macedonia | 0.0 /100 | #286 | Tragic 17.9% |
| Carpatho Rusyns | 0.0 /100 | #287 | Tragic 18.0% |
| Bahamians | 0.0 /100 | #288 | Tragic 18.0% |
| Irish | 0.0 /100 | #289 | Tragic 18.0% |
| West Indians | 0.0 /100 | #290 | Tragic 18.0% |
| Alaskan Athabascans | 0.0 /100 | #291 | Tragic 18.1% |
| Immigrants | Bahamas | 0.0 /100 | #292 | Tragic 18.1% |
| Alaska Natives | 0.0 /100 | #293 | Tragic 18.1% |
| U.S. Virgin Islanders | 0.0 /100 | #294 | Tragic 18.1% |
| Yakama | 0.0 /100 | #295 | Tragic 18.1% |
| Seminole | 0.0 /100 | #296 | Tragic 18.1% |
| French | 0.0 /100 | #297 | Tragic 18.2% |
| Africans | 0.0 /100 | #298 | Tragic 18.3% |
| Whites/Caucasians | 0.0 /100 | #299 | Tragic 18.4% |
| Immigrants | Dominican Republic | 0.0 /100 | #300 | Tragic 18.4% |
| Hungarians | 0.0 /100 | #301 | Tragic 18.5% |
| Comanche | 0.0 /100 | #302 | Tragic 18.5% |
| Celtics | 0.0 /100 | #303 | Tragic 18.5% |