Immigrants from Bolivia vs Welsh Single Father Poverty
COMPARE
Immigrants from Bolivia
Welsh
Single Father Poverty
Single Father Poverty Comparison
Immigrants from Bolivia
Welsh
14.7%
SINGLE FATHER POVERTY
100.0/ 100
METRIC RATING
35th/ 347
METRIC RANK
17.8%
SINGLE FATHER POVERTY
0.0/ 100
METRIC RATING
284th/ 347
METRIC RANK
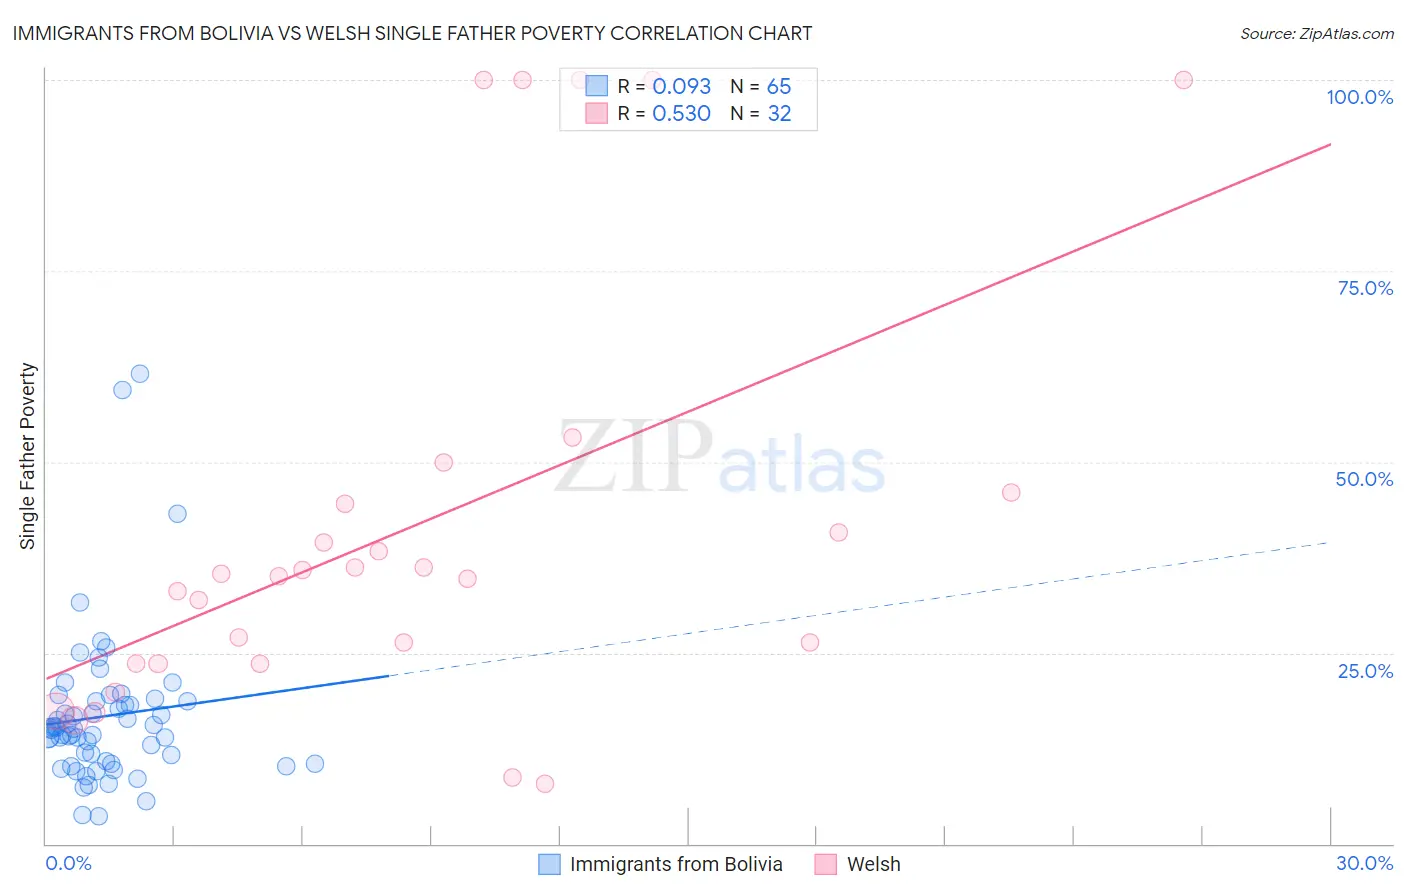
Immigrants from Bolivia vs Welsh Single Father Poverty Correlation Chart
The statistical analysis conducted on geographies consisting of 137,322,784 people shows a slight positive correlation between the proportion of Immigrants from Bolivia and poverty level among single fathers in the United States with a correlation coefficient (R) of 0.093 and weighted average of 14.7%. Similarly, the statistical analysis conducted on geographies consisting of 385,351,851 people shows a substantial positive correlation between the proportion of Welsh and poverty level among single fathers in the United States with a correlation coefficient (R) of 0.530 and weighted average of 17.8%, a difference of 21.5%.
Single Father Poverty Correlation Summary
| Measurement | Immigrants from Bolivia | Welsh |
| Minimum | 3.6% | 7.8% |
| Maximum | 61.5% | 100.0% |
| Range | 58.0% | 92.2% |
| Mean | 16.7% | 41.5% |
| Median | 15.0% | 35.2% |
| Interquartile 25% (IQ1) | 10.6% | 23.6% |
| Interquartile 75% (IQ3) | 18.6% | 45.3% |
| Interquartile Range (IQR) | 8.0% | 21.7% |
| Standard Deviation (Sample) | 10.2% | 27.8% |
| Standard Deviation (Population) | 10.1% | 27.3% |
Similar Demographics by Single Father Poverty
Demographics Similar to Immigrants from Bolivia by Single Father Poverty
In terms of single father poverty, the demographic groups most similar to Immigrants from Bolivia are Egyptian (14.7%, a difference of 0.070%), Okinawan (14.6%, a difference of 0.17%), Immigrants from Indonesia (14.7%, a difference of 0.17%), Immigrants from Eastern Africa (14.7%, a difference of 0.29%), and Bolivian (14.7%, a difference of 0.30%).
| Demographics | Rating | Rank | Single Father Poverty |
| Immigrants | South Central Asia | 100.0 /100 | #28 | Exceptional 14.5% |
| Somalis | 100.0 /100 | #29 | Exceptional 14.5% |
| Thais | 100.0 /100 | #30 | Exceptional 14.5% |
| Icelanders | 100.0 /100 | #31 | Exceptional 14.5% |
| Asians | 100.0 /100 | #32 | Exceptional 14.6% |
| Okinawans | 100.0 /100 | #33 | Exceptional 14.6% |
| Egyptians | 100.0 /100 | #34 | Exceptional 14.7% |
| Immigrants | Bolivia | 100.0 /100 | #35 | Exceptional 14.7% |
| Immigrants | Indonesia | 100.0 /100 | #36 | Exceptional 14.7% |
| Immigrants | Eastern Africa | 100.0 /100 | #37 | Exceptional 14.7% |
| Bolivians | 100.0 /100 | #38 | Exceptional 14.7% |
| Immigrants | Asia | 100.0 /100 | #39 | Exceptional 14.7% |
| Pima | 100.0 /100 | #40 | Exceptional 14.8% |
| Indians (Asian) | 100.0 /100 | #41 | Exceptional 14.8% |
| Immigrants | Nepal | 100.0 /100 | #42 | Exceptional 14.8% |
Demographics Similar to Welsh by Single Father Poverty
In terms of single father poverty, the demographic groups most similar to Welsh are Alsatian (17.8%, a difference of 0.020%), Dutch (17.8%, a difference of 0.11%), English (17.8%, a difference of 0.12%), Immigrants from Lebanon (17.9%, a difference of 0.37%), and Scottish (17.7%, a difference of 0.43%).
| Demographics | Rating | Rank | Single Father Poverty |
| Lebanese | 0.0 /100 | #277 | Tragic 17.7% |
| Germans | 0.0 /100 | #278 | Tragic 17.7% |
| Iroquois | 0.0 /100 | #279 | Tragic 17.7% |
| Scottish | 0.0 /100 | #280 | Tragic 17.7% |
| English | 0.0 /100 | #281 | Tragic 17.8% |
| Dutch | 0.0 /100 | #282 | Tragic 17.8% |
| Alsatians | 0.0 /100 | #283 | Tragic 17.8% |
| Welsh | 0.0 /100 | #284 | Tragic 17.8% |
| Immigrants | Lebanon | 0.0 /100 | #285 | Tragic 17.9% |
| Immigrants | North Macedonia | 0.0 /100 | #286 | Tragic 17.9% |
| Carpatho Rusyns | 0.0 /100 | #287 | Tragic 18.0% |
| Bahamians | 0.0 /100 | #288 | Tragic 18.0% |
| Irish | 0.0 /100 | #289 | Tragic 18.0% |
| West Indians | 0.0 /100 | #290 | Tragic 18.0% |
| Alaskan Athabascans | 0.0 /100 | #291 | Tragic 18.1% |