Irish vs Welsh Single Father Poverty
COMPARE
Irish
Welsh
Single Father Poverty
Single Father Poverty Comparison
Irish
Welsh
18.0%
SINGLE FATHER POVERTY
0.0/ 100
METRIC RATING
289th/ 347
METRIC RANK
17.8%
SINGLE FATHER POVERTY
0.0/ 100
METRIC RATING
284th/ 347
METRIC RANK
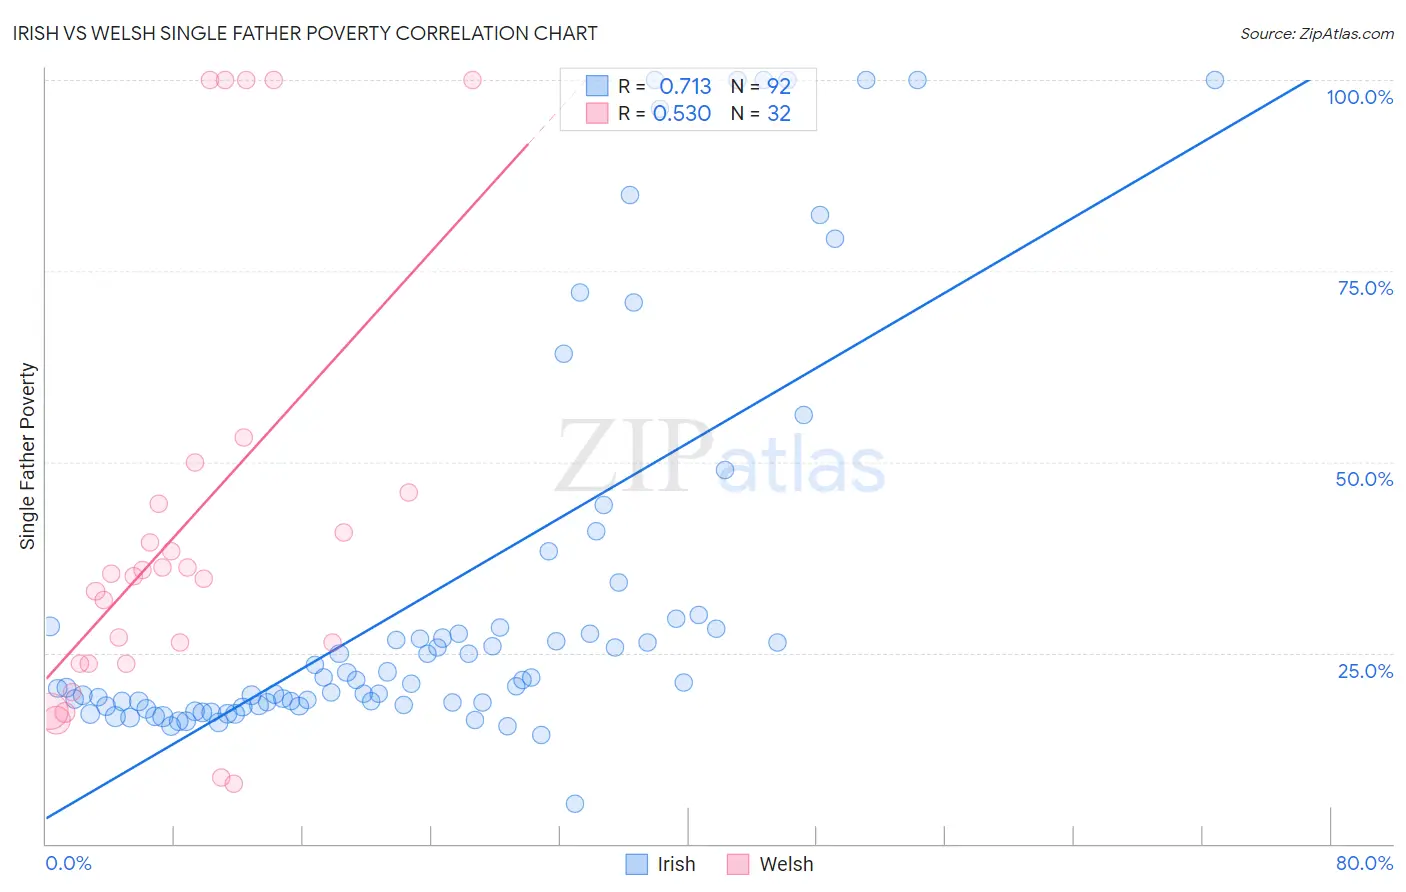
Irish vs Welsh Single Father Poverty Correlation Chart
The statistical analysis conducted on geographies consisting of 411,574,452 people shows a strong positive correlation between the proportion of Irish and poverty level among single fathers in the United States with a correlation coefficient (R) of 0.713 and weighted average of 18.0%. Similarly, the statistical analysis conducted on geographies consisting of 385,351,851 people shows a substantial positive correlation between the proportion of Welsh and poverty level among single fathers in the United States with a correlation coefficient (R) of 0.530 and weighted average of 17.8%, a difference of 1.2%.
Single Father Poverty Correlation Summary
| Measurement | Irish | Welsh |
| Minimum | 5.3% | 7.8% |
| Maximum | 100.0% | 100.0% |
| Range | 94.7% | 92.2% |
| Mean | 32.6% | 41.5% |
| Median | 21.3% | 35.2% |
| Interquartile 25% (IQ1) | 18.2% | 23.6% |
| Interquartile 75% (IQ3) | 28.4% | 45.3% |
| Interquartile Range (IQR) | 10.3% | 21.7% |
| Standard Deviation (Sample) | 25.7% | 27.8% |
| Standard Deviation (Population) | 25.6% | 27.3% |
Demographics Similar to Irish and Welsh by Single Father Poverty
In terms of single father poverty, the demographic groups most similar to Irish are West Indian (18.0%, a difference of 0.030%), Alaskan Athabascan (18.1%, a difference of 0.25%), Immigrants from Bahamas (18.1%, a difference of 0.25%), Alaska Native (18.1%, a difference of 0.36%), and U.S. Virgin Islander (18.1%, a difference of 0.39%). Similarly, the demographic groups most similar to Welsh are Alsatian (17.8%, a difference of 0.020%), Dutch (17.8%, a difference of 0.11%), English (17.8%, a difference of 0.12%), Immigrants from Lebanon (17.9%, a difference of 0.37%), and Scottish (17.7%, a difference of 0.43%).
| Demographics | Rating | Rank | Single Father Poverty |
| German Russians | 0.0 /100 | #276 | Tragic 17.7% |
| Lebanese | 0.0 /100 | #277 | Tragic 17.7% |
| Germans | 0.0 /100 | #278 | Tragic 17.7% |
| Iroquois | 0.0 /100 | #279 | Tragic 17.7% |
| Scottish | 0.0 /100 | #280 | Tragic 17.7% |
| English | 0.0 /100 | #281 | Tragic 17.8% |
| Dutch | 0.0 /100 | #282 | Tragic 17.8% |
| Alsatians | 0.0 /100 | #283 | Tragic 17.8% |
| Welsh | 0.0 /100 | #284 | Tragic 17.8% |
| Immigrants | Lebanon | 0.0 /100 | #285 | Tragic 17.9% |
| Immigrants | North Macedonia | 0.0 /100 | #286 | Tragic 17.9% |
| Carpatho Rusyns | 0.0 /100 | #287 | Tragic 18.0% |
| Bahamians | 0.0 /100 | #288 | Tragic 18.0% |
| Irish | 0.0 /100 | #289 | Tragic 18.0% |
| West Indians | 0.0 /100 | #290 | Tragic 18.0% |
| Alaskan Athabascans | 0.0 /100 | #291 | Tragic 18.1% |
| Immigrants | Bahamas | 0.0 /100 | #292 | Tragic 18.1% |
| Alaska Natives | 0.0 /100 | #293 | Tragic 18.1% |
| U.S. Virgin Islanders | 0.0 /100 | #294 | Tragic 18.1% |
| Yakama | 0.0 /100 | #295 | Tragic 18.1% |
| Seminole | 0.0 /100 | #296 | Tragic 18.1% |