Tongan vs Immigrants from Zimbabwe Per Capita Income
COMPARE
Tongan
Immigrants from Zimbabwe
Per Capita Income
Per Capita Income Comparison
Tongans
Immigrants from Zimbabwe
$41,693
PER CAPITA INCOME
9.9/ 100
METRIC RATING
216th/ 347
METRIC RANK
$47,394
PER CAPITA INCOME
98.5/ 100
METRIC RATING
93rd/ 347
METRIC RANK
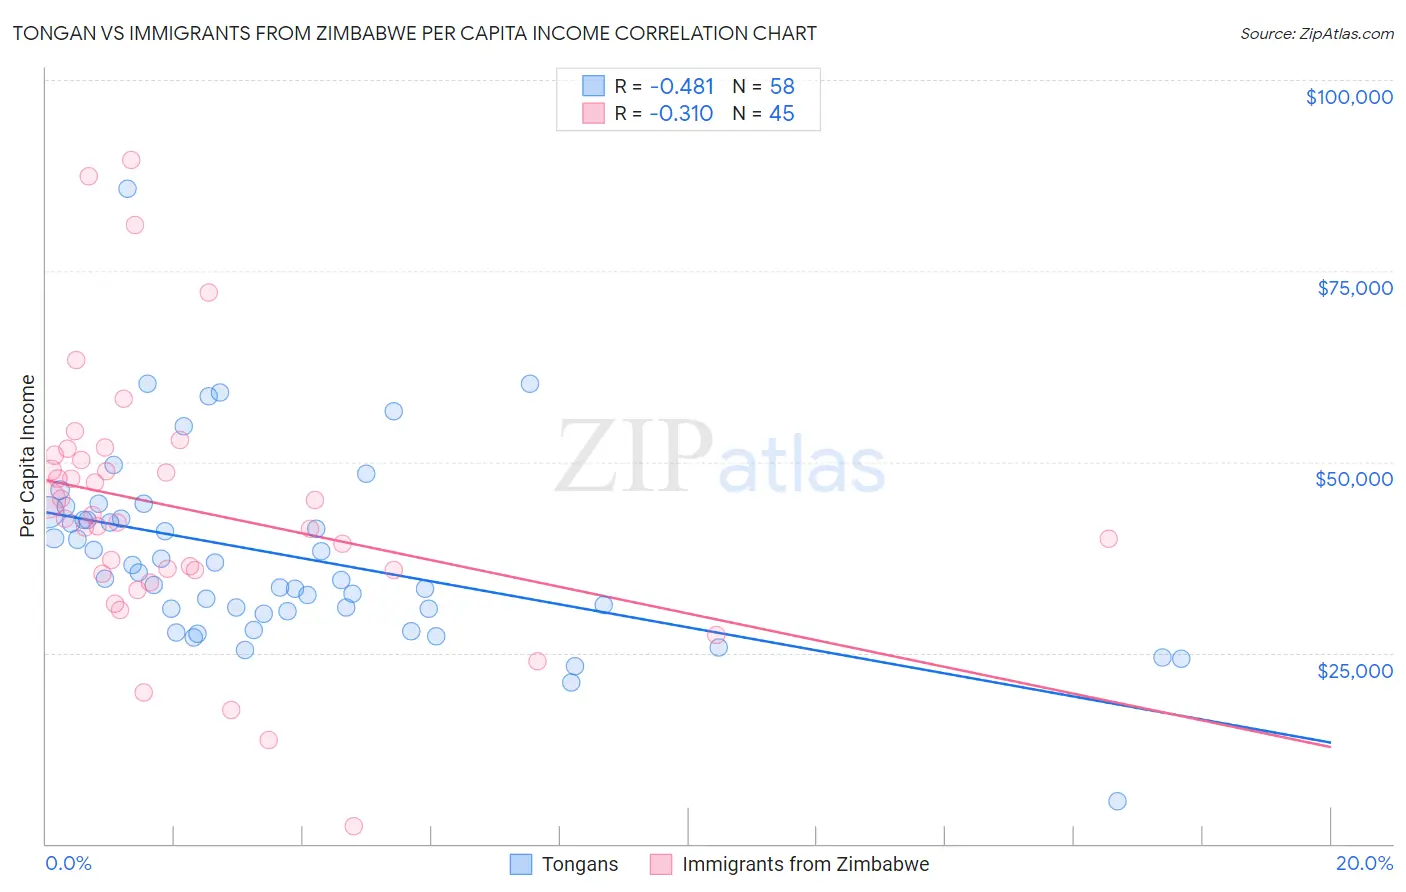
Tongan vs Immigrants from Zimbabwe Per Capita Income Correlation Chart
The statistical analysis conducted on geographies consisting of 102,908,385 people shows a moderate negative correlation between the proportion of Tongans and per capita income in the United States with a correlation coefficient (R) of -0.481 and weighted average of $41,693. Similarly, the statistical analysis conducted on geographies consisting of 117,813,757 people shows a mild negative correlation between the proportion of Immigrants from Zimbabwe and per capita income in the United States with a correlation coefficient (R) of -0.310 and weighted average of $47,394, a difference of 13.7%.
Per Capita Income Correlation Summary
| Measurement | Tongan | Immigrants from Zimbabwe |
| Minimum | $5,622 | $2,302 |
| Maximum | $85,704 | $89,578 |
| Range | $80,082 | $87,276 |
| Mean | $37,644 | $43,763 |
| Median | $35,100 | $42,560 |
| Interquartile 25% (IQ1) | $30,397 | $35,574 |
| Interquartile 75% (IQ3) | $42,507 | $50,554 |
| Interquartile Range (IQR) | $12,110 | $14,981 |
| Standard Deviation (Sample) | $12,429 | $17,068 |
| Standard Deviation (Population) | $12,321 | $16,878 |
Similar Demographics by Per Capita Income
Demographics Similar to Tongans by Per Capita Income
In terms of per capita income, the demographic groups most similar to Tongans are Sudanese ($41,695, a difference of 0.010%), Guamanian/Chamorro ($41,678, a difference of 0.030%), Immigrants from Bangladesh ($41,709, a difference of 0.040%), Immigrants from Venezuela ($41,727, a difference of 0.080%), and Trinidadian and Tobagonian ($41,655, a difference of 0.090%).
| Demographics | Rating | Rank | Per Capita Income |
| Immigrants | Sudan | 13.2 /100 | #209 | Poor $41,986 |
| Ecuadorians | 12.9 /100 | #210 | Poor $41,958 |
| Immigrants | Panama | 11.6 /100 | #211 | Poor $41,853 |
| Immigrants | Senegal | 11.3 /100 | #212 | Poor $41,830 |
| Immigrants | Venezuela | 10.2 /100 | #213 | Poor $41,727 |
| Immigrants | Bangladesh | 10.1 /100 | #214 | Poor $41,709 |
| Sudanese | 9.9 /100 | #215 | Tragic $41,695 |
| Tongans | 9.9 /100 | #216 | Tragic $41,693 |
| Guamanians/Chamorros | 9.7 /100 | #217 | Tragic $41,678 |
| Trinidadians and Tobagonians | 9.5 /100 | #218 | Tragic $41,655 |
| Puget Sound Salish | 8.1 /100 | #219 | Tragic $41,495 |
| Immigrants | Barbados | 7.9 /100 | #220 | Tragic $41,478 |
| Immigrants | Trinidad and Tobago | 7.9 /100 | #221 | Tragic $41,476 |
| Immigrants | Iraq | 7.1 /100 | #222 | Tragic $41,365 |
| Immigrants | Cameroon | 6.8 /100 | #223 | Tragic $41,334 |
Demographics Similar to Immigrants from Zimbabwe by Per Capita Income
In terms of per capita income, the demographic groups most similar to Immigrants from Zimbabwe are Albanian ($47,379, a difference of 0.030%), Immigrants from Egypt ($47,361, a difference of 0.070%), Immigrants from Moldova ($47,489, a difference of 0.20%), Alsatian ($47,284, a difference of 0.23%), and Carpatho Rusyn ($47,248, a difference of 0.31%).
| Demographics | Rating | Rank | Per Capita Income |
| Immigrants | Southern Europe | 99.3 /100 | #86 | Exceptional $48,027 |
| Ukrainians | 99.3 /100 | #87 | Exceptional $48,014 |
| Croatians | 99.0 /100 | #88 | Exceptional $47,742 |
| Northern Europeans | 98.9 /100 | #89 | Exceptional $47,698 |
| Italians | 98.8 /100 | #90 | Exceptional $47,574 |
| Macedonians | 98.8 /100 | #91 | Exceptional $47,573 |
| Immigrants | Moldova | 98.7 /100 | #92 | Exceptional $47,489 |
| Immigrants | Zimbabwe | 98.5 /100 | #93 | Exceptional $47,394 |
| Albanians | 98.5 /100 | #94 | Exceptional $47,379 |
| Immigrants | Egypt | 98.5 /100 | #95 | Exceptional $47,361 |
| Alsatians | 98.3 /100 | #96 | Exceptional $47,284 |
| Carpatho Rusyns | 98.2 /100 | #97 | Exceptional $47,248 |
| Immigrants | Pakistan | 97.9 /100 | #98 | Exceptional $47,084 |
| Laotians | 97.8 /100 | #99 | Exceptional $47,041 |
| Immigrants | Lebanon | 97.5 /100 | #100 | Exceptional $46,938 |