Tongan vs Immigrants from Zimbabwe 10th Grade
COMPARE
Tongan
Immigrants from Zimbabwe
10th Grade
10th Grade Comparison
Tongans
Immigrants from Zimbabwe
93.3%
10TH GRADE
9.5/ 100
METRIC RATING
220th/ 347
METRIC RANK
94.4%
10TH GRADE
96.8/ 100
METRIC RATING
111th/ 347
METRIC RANK
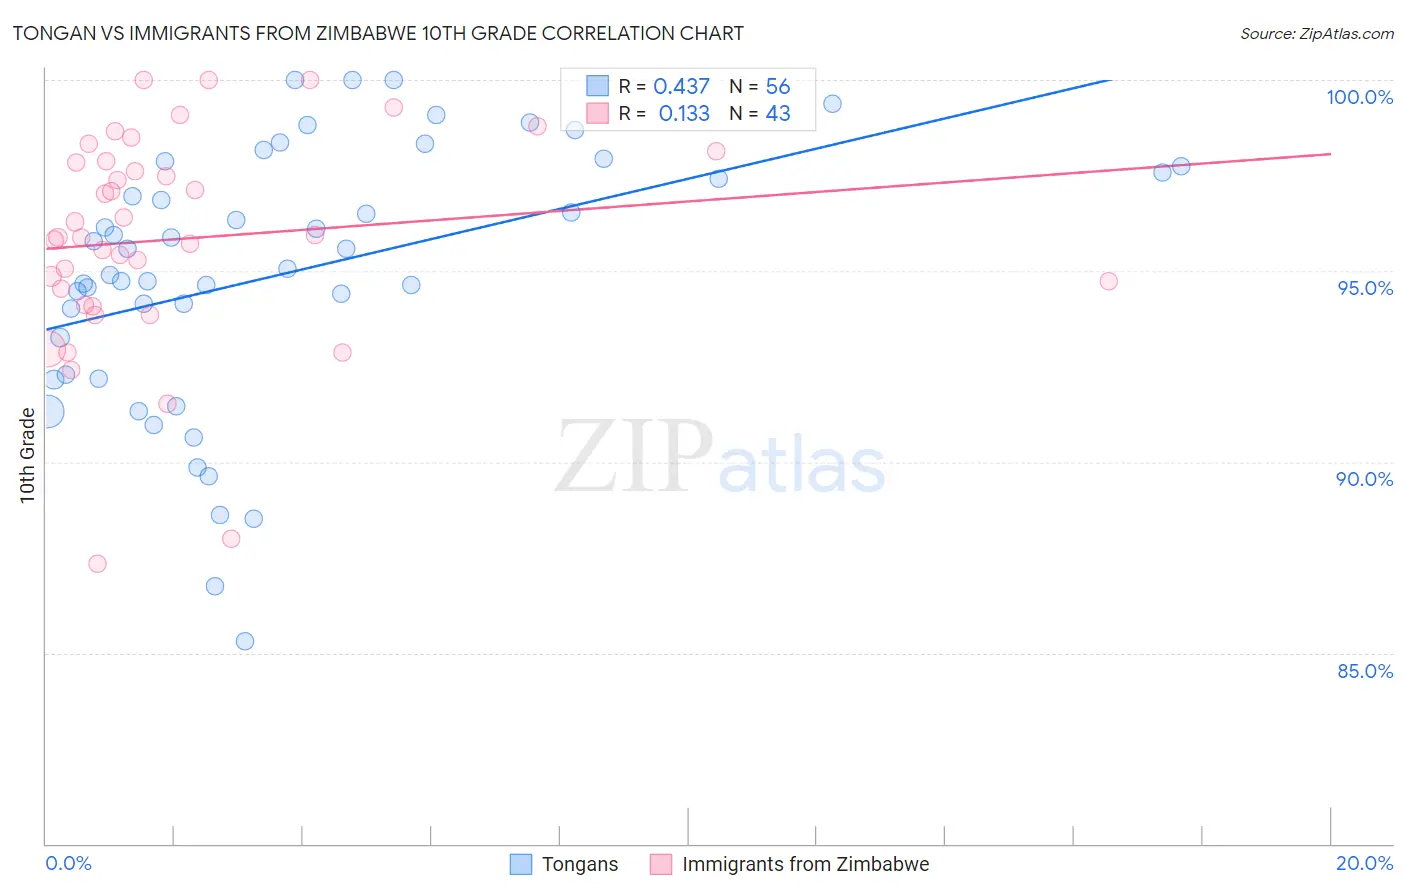
Tongan vs Immigrants from Zimbabwe 10th Grade Correlation Chart
The statistical analysis conducted on geographies consisting of 102,873,790 people shows a moderate positive correlation between the proportion of Tongans and percentage of population with at least 10th grade education in the United States with a correlation coefficient (R) of 0.437 and weighted average of 93.3%. Similarly, the statistical analysis conducted on geographies consisting of 117,809,691 people shows a poor positive correlation between the proportion of Immigrants from Zimbabwe and percentage of population with at least 10th grade education in the United States with a correlation coefficient (R) of 0.133 and weighted average of 94.4%, a difference of 1.3%.
10th Grade Correlation Summary
| Measurement | Tongan | Immigrants from Zimbabwe |
| Minimum | 85.3% | 87.3% |
| Maximum | 100.0% | 100.0% |
| Range | 14.7% | 12.7% |
| Mean | 94.9% | 95.8% |
| Median | 95.3% | 95.9% |
| Interquartile 25% (IQ1) | 92.8% | 94.1% |
| Interquartile 75% (IQ3) | 97.7% | 97.9% |
| Interquartile Range (IQR) | 4.9% | 3.8% |
| Standard Deviation (Sample) | 3.4% | 2.8% |
| Standard Deviation (Population) | 3.4% | 2.8% |
Similar Demographics by 10th Grade
Demographics Similar to Tongans by 10th Grade
In terms of 10th grade, the demographic groups most similar to Tongans are Immigrants from Liberia (93.3%, a difference of 0.020%), Seminole (93.3%, a difference of 0.020%), Immigrants from Southern Europe (93.2%, a difference of 0.020%), Ethiopian (93.2%, a difference of 0.050%), and Immigrants from Sierra Leone (93.2%, a difference of 0.050%).
| Demographics | Rating | Rank | 10th Grade |
| Immigrants | Asia | 15.7 /100 | #213 | Poor 93.4% |
| Immigrants | Bahamas | 15.2 /100 | #214 | Poor 93.4% |
| Immigrants | Oceania | 15.1 /100 | #215 | Poor 93.4% |
| Immigrants | Eastern Africa | 14.7 /100 | #216 | Poor 93.4% |
| Portuguese | 12.1 /100 | #217 | Poor 93.3% |
| Immigrants | Liberia | 10.2 /100 | #218 | Poor 93.3% |
| Seminole | 10.2 /100 | #219 | Poor 93.3% |
| Tongans | 9.5 /100 | #220 | Tragic 93.3% |
| Immigrants | Southern Europe | 8.9 /100 | #221 | Tragic 93.2% |
| Ethiopians | 7.9 /100 | #222 | Tragic 93.2% |
| Immigrants | Sierra Leone | 7.6 /100 | #223 | Tragic 93.2% |
| Bolivians | 6.7 /100 | #224 | Tragic 93.2% |
| Somalis | 6.2 /100 | #225 | Tragic 93.2% |
| Koreans | 6.1 /100 | #226 | Tragic 93.2% |
| Blacks/African Americans | 6.0 /100 | #227 | Tragic 93.2% |
Demographics Similar to Immigrants from Zimbabwe by 10th Grade
In terms of 10th grade, the demographic groups most similar to Immigrants from Zimbabwe are Immigrants from Kuwait (94.4%, a difference of 0.010%), Burmese (94.5%, a difference of 0.020%), Palestinian (94.4%, a difference of 0.020%), Immigrants from North Macedonia (94.5%, a difference of 0.030%), and Immigrants from Norway (94.5%, a difference of 0.030%).
| Demographics | Rating | Rank | 10th Grade |
| Immigrants | Romania | 97.5 /100 | #104 | Exceptional 94.5% |
| Immigrants | Turkey | 97.4 /100 | #105 | Exceptional 94.5% |
| Immigrants | Serbia | 97.4 /100 | #106 | Exceptional 94.5% |
| Immigrants | Croatia | 97.4 /100 | #107 | Exceptional 94.5% |
| Immigrants | North Macedonia | 97.2 /100 | #108 | Exceptional 94.5% |
| Immigrants | Norway | 97.2 /100 | #109 | Exceptional 94.5% |
| Burmese | 97.1 /100 | #110 | Exceptional 94.5% |
| Immigrants | Zimbabwe | 96.8 /100 | #111 | Exceptional 94.4% |
| Immigrants | Kuwait | 96.8 /100 | #112 | Exceptional 94.4% |
| Palestinians | 96.5 /100 | #113 | Exceptional 94.4% |
| German Russians | 96.3 /100 | #114 | Exceptional 94.4% |
| Delaware | 96.3 /100 | #115 | Exceptional 94.4% |
| Sioux | 96.2 /100 | #116 | Exceptional 94.4% |
| Immigrants | Hungary | 95.8 /100 | #117 | Exceptional 94.4% |
| Jordanians | 95.6 /100 | #118 | Exceptional 94.4% |