Tongan vs Iraqi Single Female Poverty
COMPARE
Tongan
Iraqi
Single Female Poverty
Single Female Poverty Comparison
Tongans
Iraqis
18.8%
SINGLE FEMALE POVERTY
99.9/ 100
METRIC RATING
38th/ 347
METRIC RANK
20.8%
SINGLE FEMALE POVERTY
64.5/ 100
METRIC RATING
164th/ 347
METRIC RANK
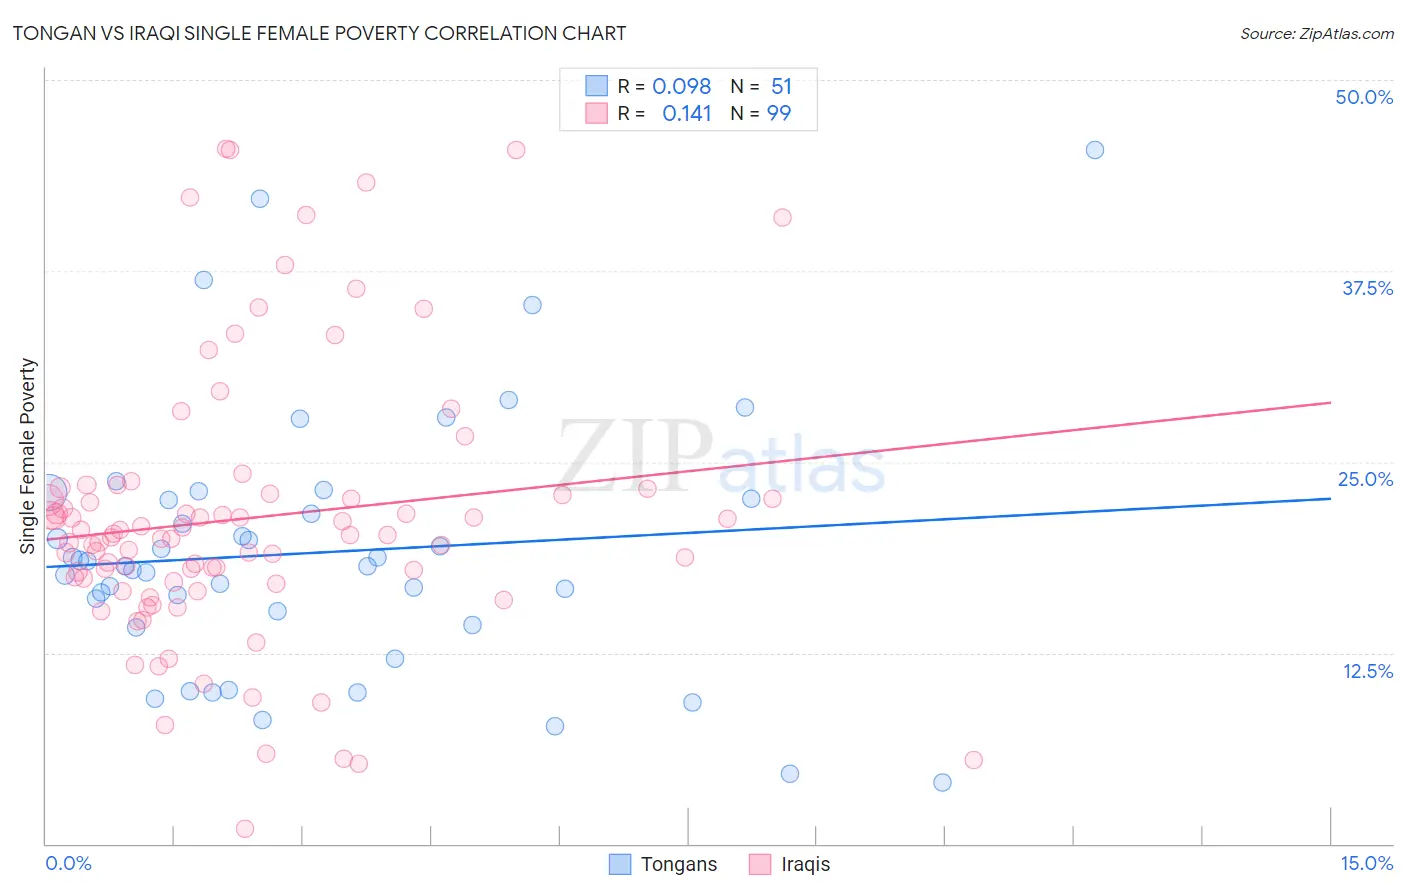
Tongan vs Iraqi Single Female Poverty Correlation Chart
The statistical analysis conducted on geographies consisting of 102,377,778 people shows a slight positive correlation between the proportion of Tongans and poverty level among single females in the United States with a correlation coefficient (R) of 0.098 and weighted average of 18.8%. Similarly, the statistical analysis conducted on geographies consisting of 169,824,152 people shows a poor positive correlation between the proportion of Iraqis and poverty level among single females in the United States with a correlation coefficient (R) of 0.141 and weighted average of 20.8%, a difference of 10.8%.
Single Female Poverty Correlation Summary
| Measurement | Tongan | Iraqi |
| Minimum | 4.0% | 0.98% |
| Maximum | 45.5% | 45.5% |
| Range | 41.5% | 44.5% |
| Mean | 19.1% | 21.3% |
| Median | 18.2% | 20.2% |
| Interquartile 25% (IQ1) | 14.3% | 17.1% |
| Interquartile 75% (IQ3) | 22.6% | 22.9% |
| Interquartile Range (IQR) | 8.2% | 5.7% |
| Standard Deviation (Sample) | 8.5% | 9.0% |
| Standard Deviation (Population) | 8.4% | 8.9% |
Similar Demographics by Single Female Poverty
Demographics Similar to Tongans by Single Female Poverty
In terms of single female poverty, the demographic groups most similar to Tongans are Bulgarian (18.8%, a difference of 0.030%), Okinawan (18.8%, a difference of 0.060%), Immigrants from Serbia (18.8%, a difference of 0.080%), Jordanian (18.8%, a difference of 0.16%), and Immigrants from Romania (18.8%, a difference of 0.31%).
| Demographics | Rating | Rank | Single Female Poverty |
| Immigrants | Asia | 99.9 /100 | #31 | Exceptional 18.6% |
| Immigrants | Sri Lanka | 99.9 /100 | #32 | Exceptional 18.6% |
| Immigrants | Philippines | 99.9 /100 | #33 | Exceptional 18.6% |
| Koreans | 99.9 /100 | #34 | Exceptional 18.6% |
| Immigrants | Japan | 99.9 /100 | #35 | Exceptional 18.6% |
| Turks | 99.9 /100 | #36 | Exceptional 18.7% |
| Immigrants | Armenia | 99.9 /100 | #37 | Exceptional 18.7% |
| Tongans | 99.9 /100 | #38 | Exceptional 18.8% |
| Bulgarians | 99.9 /100 | #39 | Exceptional 18.8% |
| Okinawans | 99.9 /100 | #40 | Exceptional 18.8% |
| Immigrants | Serbia | 99.9 /100 | #41 | Exceptional 18.8% |
| Jordanians | 99.9 /100 | #42 | Exceptional 18.8% |
| Immigrants | Romania | 99.9 /100 | #43 | Exceptional 18.8% |
| Immigrants | Croatia | 99.9 /100 | #44 | Exceptional 18.9% |
| Immigrants | Indonesia | 99.8 /100 | #45 | Exceptional 18.9% |
Demographics Similar to Iraqis by Single Female Poverty
In terms of single female poverty, the demographic groups most similar to Iraqis are Ugandan (20.8%, a difference of 0.040%), Norwegian (20.8%, a difference of 0.10%), Immigrants from Norway (20.8%, a difference of 0.10%), Immigrants from Costa Rica (20.9%, a difference of 0.20%), and Lebanese (20.8%, a difference of 0.22%).
| Demographics | Rating | Rank | Single Female Poverty |
| Immigrants | Oceania | 74.3 /100 | #157 | Good 20.7% |
| Danes | 73.0 /100 | #158 | Good 20.7% |
| Costa Ricans | 71.8 /100 | #159 | Good 20.7% |
| Arabs | 70.8 /100 | #160 | Good 20.7% |
| Kenyans | 68.5 /100 | #161 | Good 20.8% |
| Northern Europeans | 68.4 /100 | #162 | Good 20.8% |
| Lebanese | 67.6 /100 | #163 | Good 20.8% |
| Iraqis | 64.5 /100 | #164 | Good 20.8% |
| Ugandans | 64.0 /100 | #165 | Good 20.8% |
| Norwegians | 63.0 /100 | #166 | Good 20.8% |
| Immigrants | Norway | 63.0 /100 | #167 | Good 20.8% |
| Immigrants | Costa Rica | 61.5 /100 | #168 | Good 20.9% |
| Immigrants | Trinidad and Tobago | 56.3 /100 | #169 | Average 20.9% |
| New Zealanders | 53.2 /100 | #170 | Average 21.0% |
| Moroccans | 52.8 /100 | #171 | Average 21.0% |