Tongan vs Immigrants from Austria Married-Couple Family Poverty
COMPARE
Tongan
Immigrants from Austria
Married-Couple Family Poverty
Married-Couple Family Poverty Comparison
Tongans
Immigrants from Austria
4.7%
MARRIED-COUPLE FAMILY POVERTY
95.9/ 100
METRIC RATING
112th/ 347
METRIC RANK
4.5%
MARRIED-COUPLE FAMILY POVERTY
99.2/ 100
METRIC RATING
74th/ 347
METRIC RANK
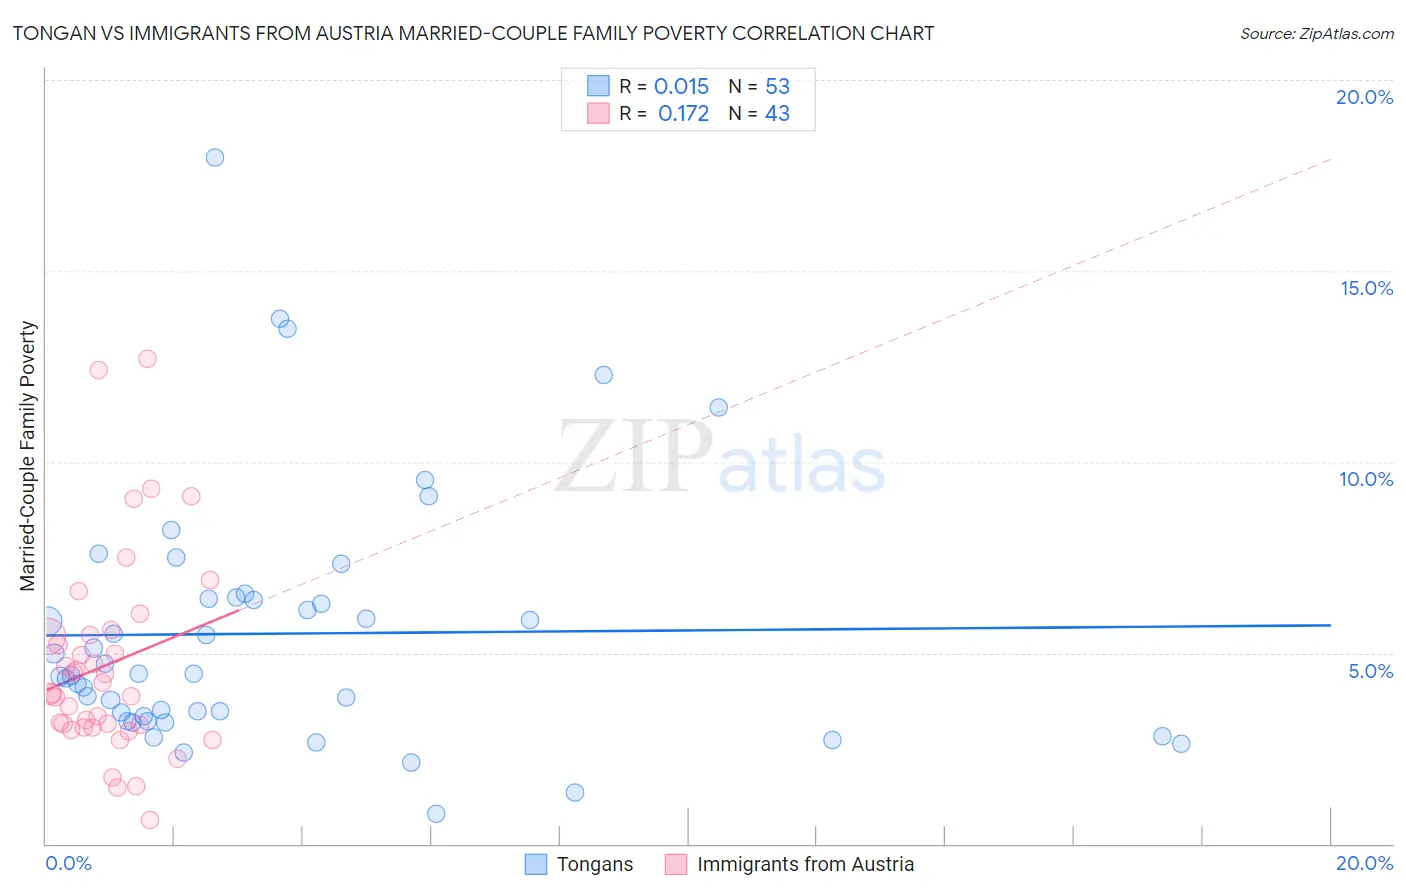
Tongan vs Immigrants from Austria Married-Couple Family Poverty Correlation Chart
The statistical analysis conducted on geographies consisting of 102,697,029 people shows no correlation between the proportion of Tongans and poverty level among married-couple families in the United States with a correlation coefficient (R) of 0.015 and weighted average of 4.7%. Similarly, the statistical analysis conducted on geographies consisting of 167,372,686 people shows a poor positive correlation between the proportion of Immigrants from Austria and poverty level among married-couple families in the United States with a correlation coefficient (R) of 0.172 and weighted average of 4.5%, a difference of 5.7%.
Married-Couple Family Poverty Correlation Summary
| Measurement | Tongan | Immigrants from Austria |
| Minimum | 0.80% | 0.61% |
| Maximum | 18.0% | 12.7% |
| Range | 17.2% | 12.1% |
| Mean | 5.5% | 4.7% |
| Median | 4.4% | 3.9% |
| Interquartile 25% (IQ1) | 3.3% | 3.0% |
| Interquartile 75% (IQ3) | 6.4% | 5.5% |
| Interquartile Range (IQR) | 3.2% | 2.4% |
| Standard Deviation (Sample) | 3.3% | 2.6% |
| Standard Deviation (Population) | 3.3% | 2.6% |
Similar Demographics by Married-Couple Family Poverty
Demographics Similar to Tongans by Married-Couple Family Poverty
In terms of married-couple family poverty, the demographic groups most similar to Tongans are Immigrants from Nepal (4.7%, a difference of 0.070%), Pakistani (4.7%, a difference of 0.18%), Immigrants from Bolivia (4.7%, a difference of 0.22%), Immigrants from Hong Kong (4.7%, a difference of 0.38%), and Laotian (4.7%, a difference of 0.58%).
| Demographics | Rating | Rank | Married-Couple Family Poverty |
| Aleuts | 97.0 /100 | #105 | Exceptional 4.7% |
| Immigrants | France | 96.9 /100 | #106 | Exceptional 4.7% |
| Immigrants | Germany | 96.8 /100 | #107 | Exceptional 4.7% |
| Laotians | 96.6 /100 | #108 | Exceptional 4.7% |
| Immigrants | Hong Kong | 96.4 /100 | #109 | Exceptional 4.7% |
| Immigrants | Bolivia | 96.2 /100 | #110 | Exceptional 4.7% |
| Pakistanis | 96.2 /100 | #111 | Exceptional 4.7% |
| Tongans | 95.9 /100 | #112 | Exceptional 4.7% |
| Immigrants | Nepal | 95.9 /100 | #113 | Exceptional 4.7% |
| Immigrants | Indonesia | 95.1 /100 | #114 | Exceptional 4.8% |
| Taiwanese | 94.8 /100 | #115 | Exceptional 4.8% |
| Celtics | 94.8 /100 | #116 | Exceptional 4.8% |
| Kenyans | 94.7 /100 | #117 | Exceptional 4.8% |
| Immigrants | Philippines | 94.6 /100 | #118 | Exceptional 4.8% |
| Immigrants | Eastern Asia | 94.0 /100 | #119 | Exceptional 4.8% |
Demographics Similar to Immigrants from Austria by Married-Couple Family Poverty
In terms of married-couple family poverty, the demographic groups most similar to Immigrants from Austria are Ukrainian (4.5%, a difference of 0.10%), Immigrants from England (4.5%, a difference of 0.22%), Cambodian (4.5%, a difference of 0.27%), Immigrants from North America (4.5%, a difference of 0.32%), and Immigrants from South Africa (4.5%, a difference of 0.38%).
| Demographics | Rating | Rank | Married-Couple Family Poverty |
| Immigrants | Canada | 99.4 /100 | #67 | Exceptional 4.4% |
| Slavs | 99.4 /100 | #68 | Exceptional 4.4% |
| New Zealanders | 99.4 /100 | #69 | Exceptional 4.4% |
| Immigrants | Korea | 99.4 /100 | #70 | Exceptional 4.5% |
| Immigrants | North America | 99.3 /100 | #71 | Exceptional 4.5% |
| Immigrants | England | 99.3 /100 | #72 | Exceptional 4.5% |
| Ukrainians | 99.2 /100 | #73 | Exceptional 4.5% |
| Immigrants | Austria | 99.2 /100 | #74 | Exceptional 4.5% |
| Cambodians | 99.2 /100 | #75 | Exceptional 4.5% |
| Immigrants | South Africa | 99.1 /100 | #76 | Exceptional 4.5% |
| Immigrants | Latvia | 99.1 /100 | #77 | Exceptional 4.5% |
| Scotch-Irish | 99.1 /100 | #78 | Exceptional 4.5% |
| Immigrants | Iran | 99.0 /100 | #79 | Exceptional 4.5% |
| Icelanders | 99.0 /100 | #80 | Exceptional 4.5% |
| Immigrants | Greece | 98.9 /100 | #81 | Exceptional 4.5% |