Tohono O'odham vs Assyrian/Chaldean/Syriac Single Father Poverty
COMPARE
Tohono O'odham
Assyrian/Chaldean/Syriac
Single Father Poverty
Single Father Poverty Comparison
Tohono O'odham
Assyrians/Chaldeans/Syriacs
22.0%
SINGLE FATHER POVERTY
0.0/ 100
METRIC RATING
332nd/ 347
METRIC RANK
11.7%
SINGLE FATHER POVERTY
100.0/ 100
METRIC RATING
1st/ 347
METRIC RANK
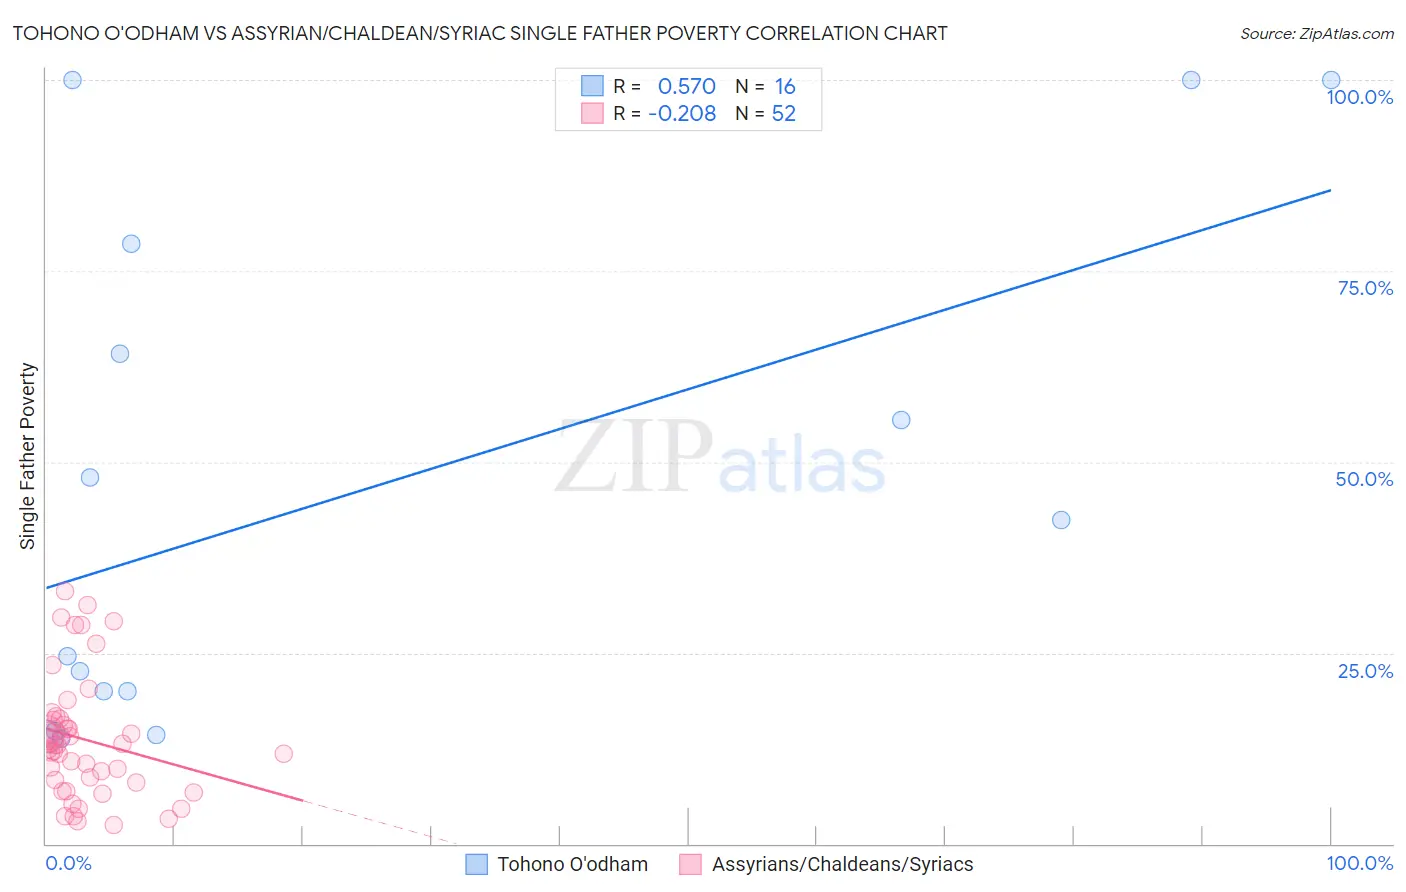
Tohono O'odham vs Assyrian/Chaldean/Syriac Single Father Poverty Correlation Chart
The statistical analysis conducted on geographies consisting of 55,933,384 people shows a substantial positive correlation between the proportion of Tohono O'odham and poverty level among single fathers in the United States with a correlation coefficient (R) of 0.570 and weighted average of 22.0%. Similarly, the statistical analysis conducted on geographies consisting of 96,953,976 people shows a weak negative correlation between the proportion of Assyrians/Chaldeans/Syriacs and poverty level among single fathers in the United States with a correlation coefficient (R) of -0.208 and weighted average of 11.7%, a difference of 87.7%.
Single Father Poverty Correlation Summary
| Measurement | Tohono O'odham | Assyrian/Chaldean/Syriac |
| Minimum | 13.8% | 2.4% |
| Maximum | 100.0% | 33.0% |
| Range | 86.2% | 30.5% |
| Mean | 45.8% | 13.7% |
| Median | 33.5% | 12.9% |
| Interquartile 25% (IQ1) | 17.4% | 8.2% |
| Interquartile 75% (IQ3) | 71.4% | 16.3% |
| Interquartile Range (IQR) | 54.0% | 8.1% |
| Standard Deviation (Sample) | 33.3% | 7.8% |
| Standard Deviation (Population) | 32.3% | 7.8% |
Similar Demographics by Single Father Poverty
Demographics Similar to Tohono O'odham by Single Father Poverty
In terms of single father poverty, the demographic groups most similar to Tohono O'odham are Central American Indian (21.7%, a difference of 1.5%), Native/Alaskan (22.4%, a difference of 1.7%), Paiute (21.6%, a difference of 1.8%), Kiowa (22.5%, a difference of 2.1%), and Colville (21.4%, a difference of 3.1%).
| Demographics | Rating | Rank | Single Father Poverty |
| Blacks/African Americans | 0.0 /100 | #325 | Tragic 20.4% |
| Immigrants | Yemen | 0.0 /100 | #326 | Tragic 20.6% |
| Choctaw | 0.0 /100 | #327 | Tragic 20.7% |
| Pueblo | 0.0 /100 | #328 | Tragic 21.1% |
| Colville | 0.0 /100 | #329 | Tragic 21.4% |
| Paiute | 0.0 /100 | #330 | Tragic 21.6% |
| Central American Indians | 0.0 /100 | #331 | Tragic 21.7% |
| Tohono O'odham | 0.0 /100 | #332 | Tragic 22.0% |
| Natives/Alaskans | 0.0 /100 | #333 | Tragic 22.4% |
| Kiowa | 0.0 /100 | #334 | Tragic 22.5% |
| Shoshone | 0.0 /100 | #335 | Tragic 22.9% |
| Cajuns | 0.0 /100 | #336 | Tragic 23.1% |
| Sioux | 0.0 /100 | #337 | Tragic 23.9% |
| Arapaho | 0.0 /100 | #338 | Tragic 24.0% |
| Apache | 0.0 /100 | #339 | Tragic 24.2% |
Demographics Similar to Assyrians/Chaldeans/Syriacs by Single Father Poverty
In terms of single father poverty, the demographic groups most similar to Assyrians/Chaldeans/Syriacs are Tongan (12.2%, a difference of 4.2%), Tsimshian (12.7%, a difference of 8.3%), Immigrants from Fiji (13.2%, a difference of 12.8%), Immigrants from Ethiopia (13.4%, a difference of 14.6%), and Ethiopian (13.5%, a difference of 15.5%).
| Demographics | Rating | Rank | Single Father Poverty |
| Assyrians/Chaldeans/Syriacs | 100.0 /100 | #1 | Exceptional 11.7% |
| Tongans | 100.0 /100 | #2 | Exceptional 12.2% |
| Tsimshian | 100.0 /100 | #3 | Exceptional 12.7% |
| Immigrants | Fiji | 100.0 /100 | #4 | Exceptional 13.2% |
| Immigrants | Ethiopia | 100.0 /100 | #5 | Exceptional 13.4% |
| Ethiopians | 100.0 /100 | #6 | Exceptional 13.5% |
| Immigrants | Taiwan | 100.0 /100 | #7 | Exceptional 13.7% |
| Samoans | 100.0 /100 | #8 | Exceptional 13.8% |
| Afghans | 100.0 /100 | #9 | Exceptional 14.0% |
| Koreans | 100.0 /100 | #10 | Exceptional 14.0% |
| Filipinos | 100.0 /100 | #11 | Exceptional 14.0% |
| Immigrants | India | 100.0 /100 | #12 | Exceptional 14.0% |
| Immigrants | Philippines | 100.0 /100 | #13 | Exceptional 14.0% |
| Immigrants | Vietnam | 100.0 /100 | #14 | Exceptional 14.1% |
| Sri Lankans | 100.0 /100 | #15 | Exceptional 14.2% |