Tohono O'odham vs Osage Single Father Poverty
COMPARE
Tohono O'odham
Osage
Single Father Poverty
Single Father Poverty Comparison
Tohono O'odham
Osage
22.0%
SINGLE FATHER POVERTY
0.0/ 100
METRIC RATING
332nd/ 347
METRIC RANK
19.0%
SINGLE FATHER POVERTY
0.0/ 100
METRIC RATING
316th/ 347
METRIC RANK
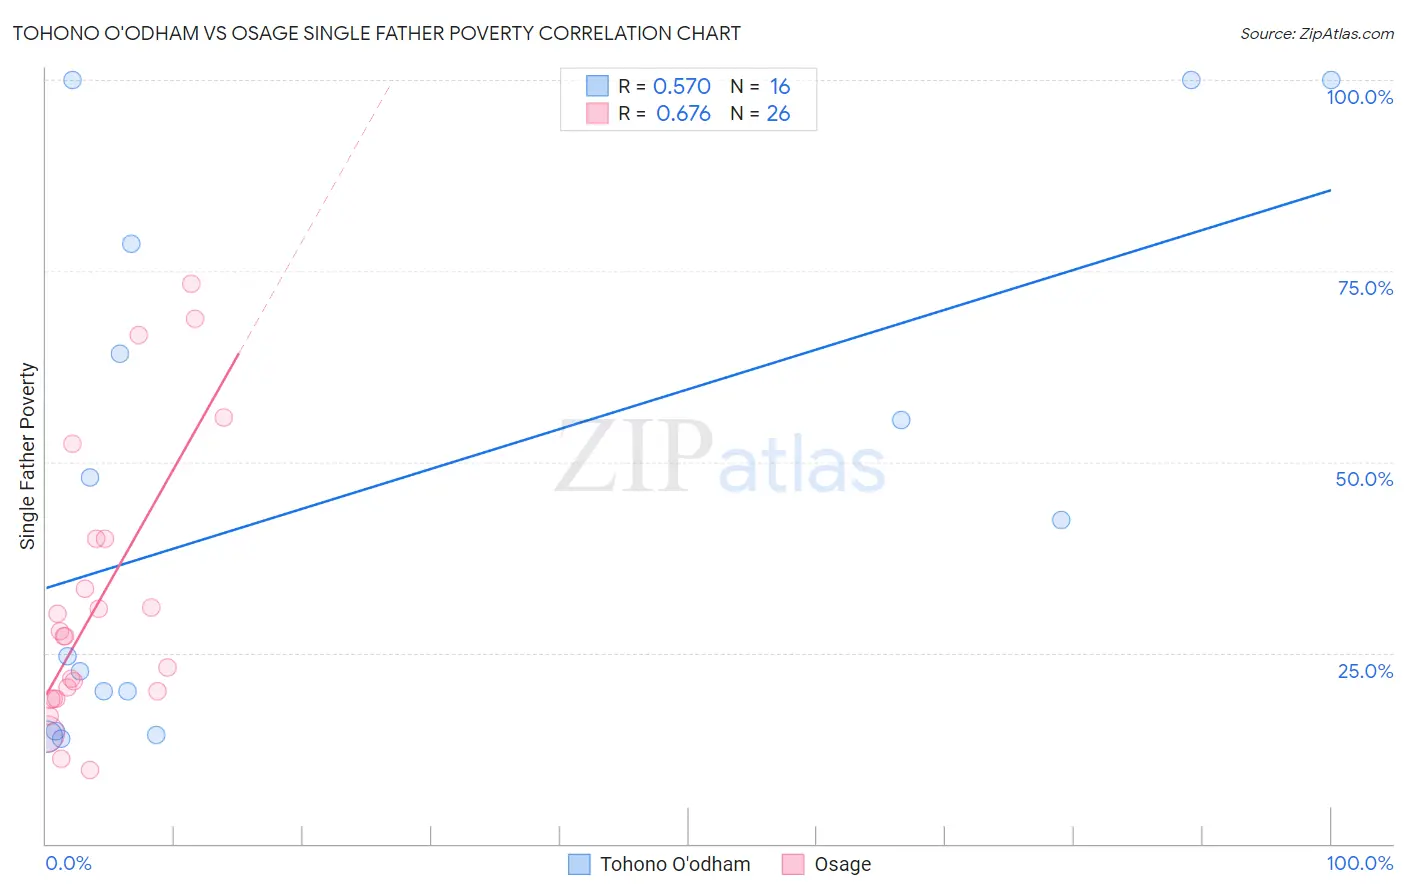
Tohono O'odham vs Osage Single Father Poverty Correlation Chart
The statistical analysis conducted on geographies consisting of 55,933,384 people shows a substantial positive correlation between the proportion of Tohono O'odham and poverty level among single fathers in the United States with a correlation coefficient (R) of 0.570 and weighted average of 22.0%. Similarly, the statistical analysis conducted on geographies consisting of 82,975,637 people shows a significant positive correlation between the proportion of Osage and poverty level among single fathers in the United States with a correlation coefficient (R) of 0.676 and weighted average of 19.0%, a difference of 15.7%.
Single Father Poverty Correlation Summary
| Measurement | Tohono O'odham | Osage |
| Minimum | 13.8% | 9.7% |
| Maximum | 100.0% | 73.3% |
| Range | 86.2% | 63.7% |
| Mean | 45.8% | 31.5% |
| Median | 33.5% | 27.1% |
| Interquartile 25% (IQ1) | 17.4% | 19.0% |
| Interquartile 75% (IQ3) | 71.4% | 40.0% |
| Interquartile Range (IQR) | 54.0% | 21.0% |
| Standard Deviation (Sample) | 33.3% | 17.9% |
| Standard Deviation (Population) | 32.3% | 17.5% |
Demographics Similar to Tohono O'odham and Osage by Single Father Poverty
In terms of single father poverty, the demographic groups most similar to Tohono O'odham are Central American Indian (21.7%, a difference of 1.5%), Native/Alaskan (22.4%, a difference of 1.7%), Paiute (21.6%, a difference of 1.8%), Kiowa (22.5%, a difference of 2.1%), and Colville (21.4%, a difference of 3.1%). Similarly, the demographic groups most similar to Osage are Dominican (19.1%, a difference of 0.31%), Chickasaw (19.0%, a difference of 0.40%), Delaware (18.9%, a difference of 0.56%), Dutch West Indian (19.2%, a difference of 0.89%), and Slovak (19.3%, a difference of 1.4%).
| Demographics | Rating | Rank | Single Father Poverty |
| Delaware | 0.0 /100 | #314 | Tragic 18.9% |
| Chickasaw | 0.0 /100 | #315 | Tragic 19.0% |
| Osage | 0.0 /100 | #316 | Tragic 19.0% |
| Dominicans | 0.0 /100 | #317 | Tragic 19.1% |
| Dutch West Indians | 0.0 /100 | #318 | Tragic 19.2% |
| Slovaks | 0.0 /100 | #319 | Tragic 19.3% |
| Inupiat | 0.0 /100 | #320 | Tragic 19.5% |
| Cherokee | 0.0 /100 | #321 | Tragic 19.6% |
| Creek | 0.0 /100 | #322 | Tragic 19.8% |
| Pennsylvania Germans | 0.0 /100 | #323 | Tragic 20.0% |
| Americans | 0.0 /100 | #324 | Tragic 20.1% |
| Blacks/African Americans | 0.0 /100 | #325 | Tragic 20.4% |
| Immigrants | Yemen | 0.0 /100 | #326 | Tragic 20.6% |
| Choctaw | 0.0 /100 | #327 | Tragic 20.7% |
| Pueblo | 0.0 /100 | #328 | Tragic 21.1% |
| Colville | 0.0 /100 | #329 | Tragic 21.4% |
| Paiute | 0.0 /100 | #330 | Tragic 21.6% |
| Central American Indians | 0.0 /100 | #331 | Tragic 21.7% |
| Tohono O'odham | 0.0 /100 | #332 | Tragic 22.0% |
| Natives/Alaskans | 0.0 /100 | #333 | Tragic 22.4% |
| Kiowa | 0.0 /100 | #334 | Tragic 22.5% |