Tohono O'odham vs Ukrainian Single Father Poverty
COMPARE
Tohono O'odham
Ukrainian
Single Father Poverty
Single Father Poverty Comparison
Tohono O'odham
Ukrainians
22.0%
SINGLE FATHER POVERTY
0.0/ 100
METRIC RATING
332nd/ 347
METRIC RANK
16.4%
SINGLE FATHER POVERTY
30.4/ 100
METRIC RATING
187th/ 347
METRIC RANK
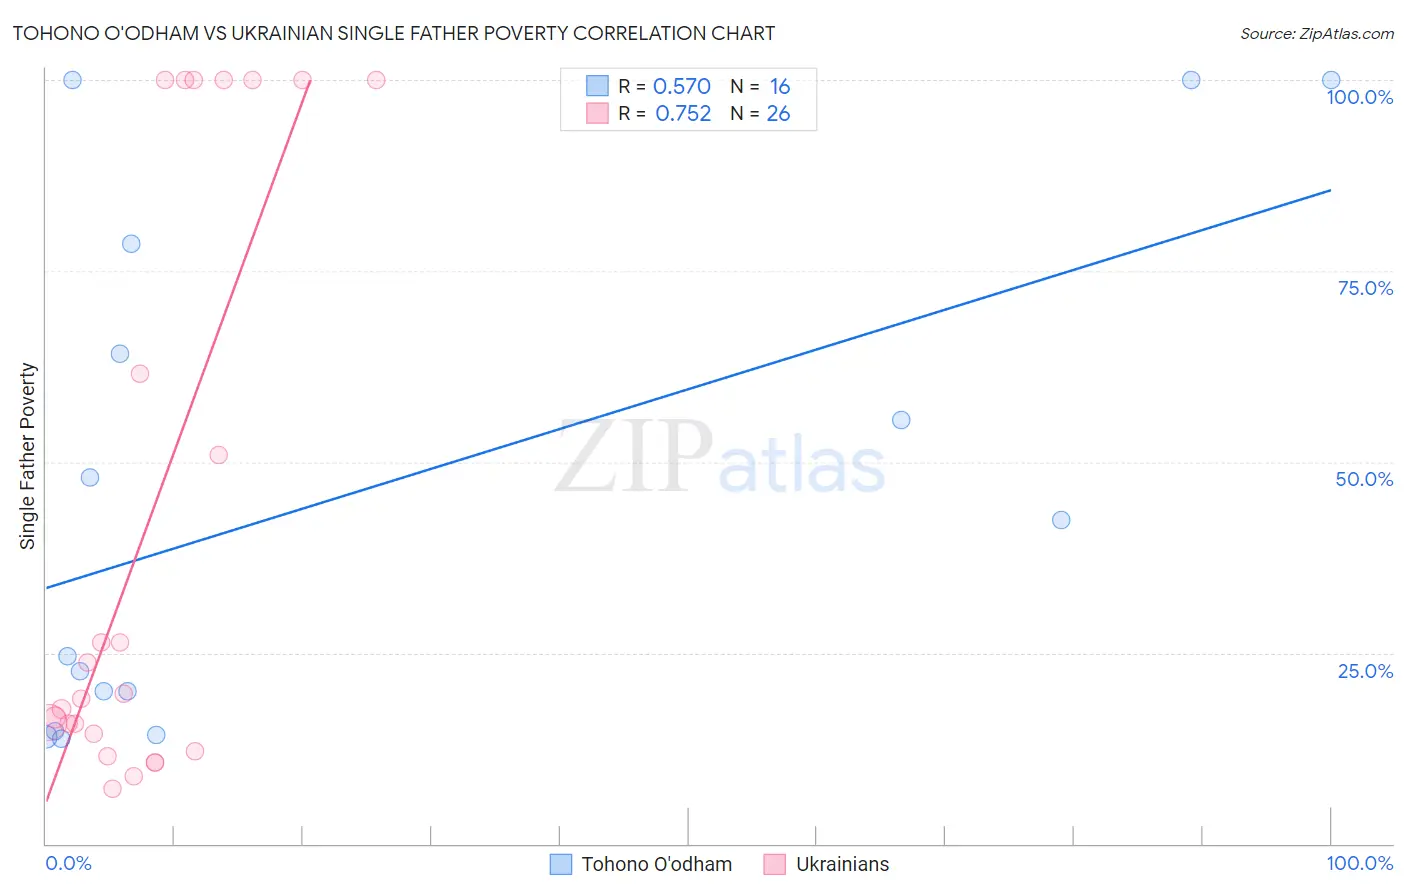
Tohono O'odham vs Ukrainian Single Father Poverty Correlation Chart
The statistical analysis conducted on geographies consisting of 55,933,384 people shows a substantial positive correlation between the proportion of Tohono O'odham and poverty level among single fathers in the United States with a correlation coefficient (R) of 0.570 and weighted average of 22.0%. Similarly, the statistical analysis conducted on geographies consisting of 337,652,190 people shows a strong positive correlation between the proportion of Ukrainians and poverty level among single fathers in the United States with a correlation coefficient (R) of 0.752 and weighted average of 16.4%, a difference of 33.9%.
Single Father Poverty Correlation Summary
| Measurement | Tohono O'odham | Ukrainian |
| Minimum | 13.8% | 7.2% |
| Maximum | 100.0% | 100.0% |
| Range | 86.2% | 92.8% |
| Mean | 45.8% | 41.7% |
| Median | 33.5% | 19.4% |
| Interquartile 25% (IQ1) | 17.4% | 14.5% |
| Interquartile 75% (IQ3) | 71.4% | 100.0% |
| Interquartile Range (IQR) | 54.0% | 85.5% |
| Standard Deviation (Sample) | 33.3% | 38.0% |
| Standard Deviation (Population) | 32.3% | 37.2% |
Similar Demographics by Single Father Poverty
Demographics Similar to Tohono O'odham by Single Father Poverty
In terms of single father poverty, the demographic groups most similar to Tohono O'odham are Central American Indian (21.7%, a difference of 1.5%), Native/Alaskan (22.4%, a difference of 1.7%), Paiute (21.6%, a difference of 1.8%), Kiowa (22.5%, a difference of 2.1%), and Colville (21.4%, a difference of 3.1%).
| Demographics | Rating | Rank | Single Father Poverty |
| Blacks/African Americans | 0.0 /100 | #325 | Tragic 20.4% |
| Immigrants | Yemen | 0.0 /100 | #326 | Tragic 20.6% |
| Choctaw | 0.0 /100 | #327 | Tragic 20.7% |
| Pueblo | 0.0 /100 | #328 | Tragic 21.1% |
| Colville | 0.0 /100 | #329 | Tragic 21.4% |
| Paiute | 0.0 /100 | #330 | Tragic 21.6% |
| Central American Indians | 0.0 /100 | #331 | Tragic 21.7% |
| Tohono O'odham | 0.0 /100 | #332 | Tragic 22.0% |
| Natives/Alaskans | 0.0 /100 | #333 | Tragic 22.4% |
| Kiowa | 0.0 /100 | #334 | Tragic 22.5% |
| Shoshone | 0.0 /100 | #335 | Tragic 22.9% |
| Cajuns | 0.0 /100 | #336 | Tragic 23.1% |
| Sioux | 0.0 /100 | #337 | Tragic 23.9% |
| Arapaho | 0.0 /100 | #338 | Tragic 24.0% |
| Apache | 0.0 /100 | #339 | Tragic 24.2% |
Demographics Similar to Ukrainians by Single Father Poverty
In terms of single father poverty, the demographic groups most similar to Ukrainians are Russian (16.4%, a difference of 0.020%), Immigrants from Venezuela (16.4%, a difference of 0.030%), Latvian (16.5%, a difference of 0.080%), Immigrants from Burma/Myanmar (16.5%, a difference of 0.12%), and Panamanian (16.4%, a difference of 0.16%).
| Demographics | Rating | Rank | Single Father Poverty |
| Immigrants | Latin America | 37.2 /100 | #180 | Fair 16.4% |
| Immigrants | Western Africa | 36.0 /100 | #181 | Fair 16.4% |
| Immigrants | Italy | 35.7 /100 | #182 | Fair 16.4% |
| Aleuts | 35.3 /100 | #183 | Fair 16.4% |
| Cambodians | 34.6 /100 | #184 | Fair 16.4% |
| Panamanians | 33.6 /100 | #185 | Fair 16.4% |
| Immigrants | Venezuela | 31.0 /100 | #186 | Fair 16.4% |
| Ukrainians | 30.4 /100 | #187 | Fair 16.4% |
| Russians | 30.1 /100 | #188 | Fair 16.4% |
| Latvians | 28.9 /100 | #189 | Fair 16.5% |
| Immigrants | Burma/Myanmar | 28.0 /100 | #190 | Fair 16.5% |
| Immigrants | Guyana | 27.1 /100 | #191 | Fair 16.5% |
| Immigrants | Switzerland | 24.8 /100 | #192 | Fair 16.5% |
| Ecuadorians | 24.5 /100 | #193 | Fair 16.5% |
| Cape Verdeans | 24.4 /100 | #194 | Fair 16.5% |