Venezuelan vs Assyrian/Chaldean/Syriac Single Father Poverty
COMPARE
Venezuelan
Assyrian/Chaldean/Syriac
Single Father Poverty
Single Father Poverty Comparison
Venezuelans
Assyrians/Chaldeans/Syriacs
16.6%
SINGLE FATHER POVERTY
14.3/ 100
METRIC RATING
205th/ 347
METRIC RANK
11.7%
SINGLE FATHER POVERTY
100.0/ 100
METRIC RATING
1st/ 347
METRIC RANK
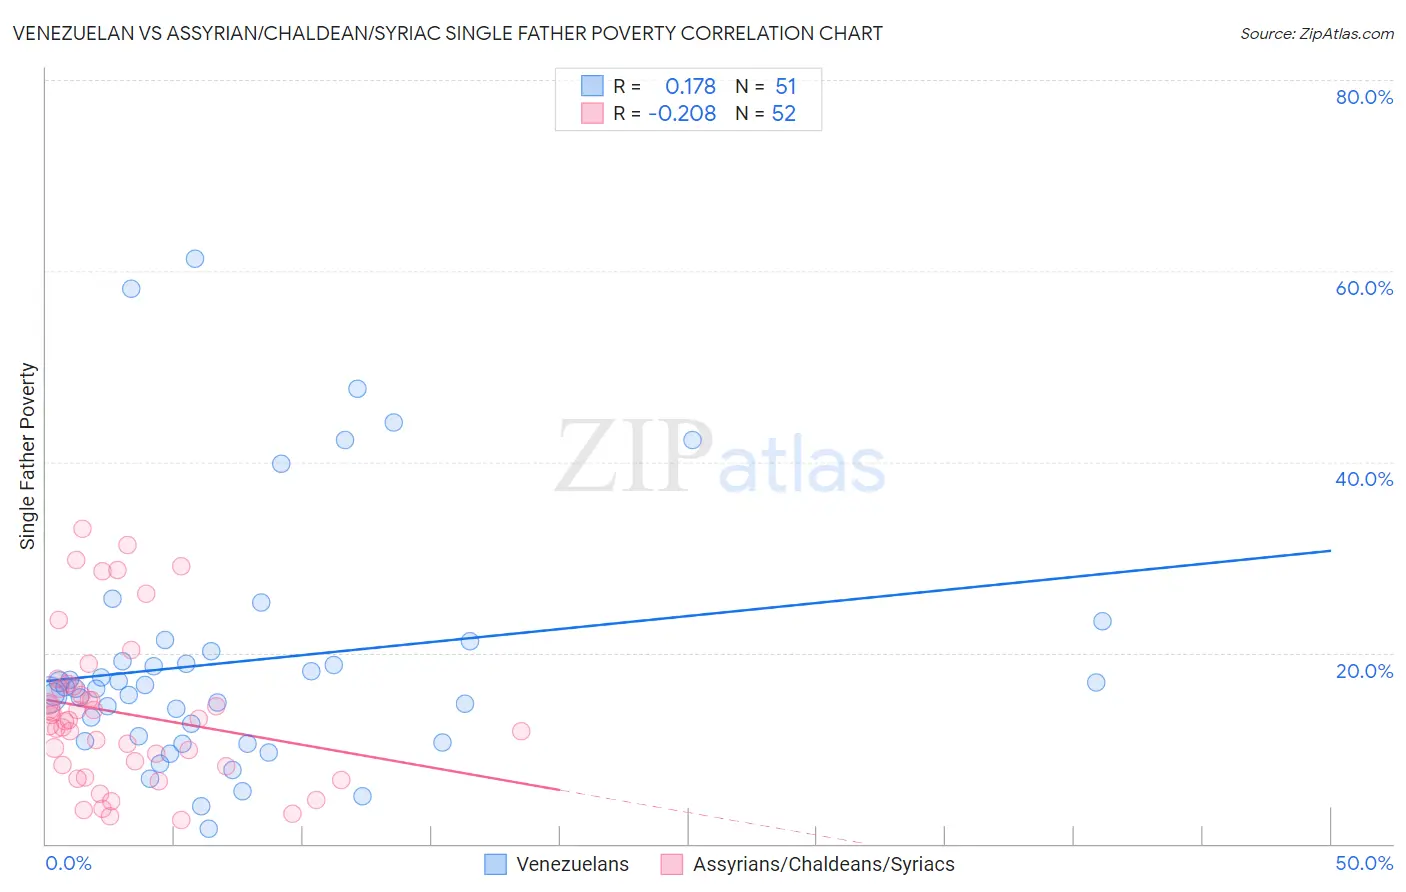
Venezuelan vs Assyrian/Chaldean/Syriac Single Father Poverty Correlation Chart
The statistical analysis conducted on geographies consisting of 250,129,202 people shows a poor positive correlation between the proportion of Venezuelans and poverty level among single fathers in the United States with a correlation coefficient (R) of 0.178 and weighted average of 16.6%. Similarly, the statistical analysis conducted on geographies consisting of 96,953,976 people shows a weak negative correlation between the proportion of Assyrians/Chaldeans/Syriacs and poverty level among single fathers in the United States with a correlation coefficient (R) of -0.208 and weighted average of 11.7%, a difference of 41.7%.
Single Father Poverty Correlation Summary
| Measurement | Venezuelan | Assyrian/Chaldean/Syriac |
| Minimum | 1.6% | 2.4% |
| Maximum | 61.3% | 33.0% |
| Range | 59.7% | 30.5% |
| Mean | 19.1% | 13.7% |
| Median | 16.3% | 12.9% |
| Interquartile 25% (IQ1) | 10.7% | 8.2% |
| Interquartile 75% (IQ3) | 20.2% | 16.3% |
| Interquartile Range (IQR) | 9.5% | 8.1% |
| Standard Deviation (Sample) | 13.0% | 7.8% |
| Standard Deviation (Population) | 12.9% | 7.8% |
Similar Demographics by Single Father Poverty
Demographics Similar to Venezuelans by Single Father Poverty
In terms of single father poverty, the demographic groups most similar to Venezuelans are Immigrants from Guatemala (16.6%, a difference of 0.040%), Immigrants from Senegal (16.6%, a difference of 0.050%), New Zealander (16.6%, a difference of 0.050%), Eastern European (16.6%, a difference of 0.050%), and Immigrants from North America (16.6%, a difference of 0.070%).
| Demographics | Rating | Rank | Single Father Poverty |
| Romanians | 20.1 /100 | #198 | Fair 16.5% |
| Immigrants | Belize | 19.8 /100 | #199 | Poor 16.5% |
| Syrians | 17.4 /100 | #200 | Poor 16.6% |
| Cubans | 16.5 /100 | #201 | Poor 16.6% |
| Immigrants | Croatia | 16.5 /100 | #202 | Poor 16.6% |
| Immigrants | North America | 15.1 /100 | #203 | Poor 16.6% |
| Immigrants | Guatemala | 14.8 /100 | #204 | Poor 16.6% |
| Venezuelans | 14.3 /100 | #205 | Poor 16.6% |
| Immigrants | Senegal | 13.7 /100 | #206 | Poor 16.6% |
| New Zealanders | 13.7 /100 | #207 | Poor 16.6% |
| Eastern Europeans | 13.7 /100 | #208 | Poor 16.6% |
| Europeans | 13.2 /100 | #209 | Poor 16.6% |
| Guatemalans | 12.9 /100 | #210 | Poor 16.6% |
| Arabs | 12.8 /100 | #211 | Poor 16.6% |
| Immigrants | Southern Europe | 11.2 /100 | #212 | Poor 16.7% |
Demographics Similar to Assyrians/Chaldeans/Syriacs by Single Father Poverty
In terms of single father poverty, the demographic groups most similar to Assyrians/Chaldeans/Syriacs are Tongan (12.2%, a difference of 4.2%), Tsimshian (12.7%, a difference of 8.3%), Immigrants from Fiji (13.2%, a difference of 12.8%), Immigrants from Ethiopia (13.4%, a difference of 14.6%), and Ethiopian (13.5%, a difference of 15.5%).
| Demographics | Rating | Rank | Single Father Poverty |
| Assyrians/Chaldeans/Syriacs | 100.0 /100 | #1 | Exceptional 11.7% |
| Tongans | 100.0 /100 | #2 | Exceptional 12.2% |
| Tsimshian | 100.0 /100 | #3 | Exceptional 12.7% |
| Immigrants | Fiji | 100.0 /100 | #4 | Exceptional 13.2% |
| Immigrants | Ethiopia | 100.0 /100 | #5 | Exceptional 13.4% |
| Ethiopians | 100.0 /100 | #6 | Exceptional 13.5% |
| Immigrants | Taiwan | 100.0 /100 | #7 | Exceptional 13.7% |
| Samoans | 100.0 /100 | #8 | Exceptional 13.8% |
| Afghans | 100.0 /100 | #9 | Exceptional 14.0% |
| Koreans | 100.0 /100 | #10 | Exceptional 14.0% |
| Filipinos | 100.0 /100 | #11 | Exceptional 14.0% |
| Immigrants | India | 100.0 /100 | #12 | Exceptional 14.0% |
| Immigrants | Philippines | 100.0 /100 | #13 | Exceptional 14.0% |
| Immigrants | Vietnam | 100.0 /100 | #14 | Exceptional 14.1% |
| Sri Lankans | 100.0 /100 | #15 | Exceptional 14.2% |