Slovene vs Assyrian/Chaldean/Syriac Single Father Poverty

COMPARE

Slovene
Race
Ancestry
AfghanAfricanAlaska NativeAlaskan AthabascanAlbanianAleutAlsatianAmericanApacheArabArapahoArgentineanArmenianAustralianAustrianBahamianBangladeshiBarbadianBasqueBelgianBelizeanBermudanBhutaneseBlackfeetBolivianBrazilianBritishBritish West IndianBulgarianBurmeseCajunCambodianCanadianCape VerdeanCarpatho RusynCelticCentral AmericanCentral American IndianCherokeeCheyenneChickasawChileanChineseChippewaChoctawColombianColvilleComancheCosta RicanCreeCreekCroatianCrowCubanCypriotCzechCzechoslovakianDanishDelawareDominicanDutchDutch West IndianEastern EuropeanEcuadorianEgyptianEnglishEstonianEthiopianEuropeanFijianFilipinoFinnishFrenchFrench American IndianFrench CanadianGermanGerman RussianGhanaianGreekGuamanian/ChamorroGuatemalanGuyaneseHaitianHmongHonduranHopiHoumaHungarianIcelanderIndian (Asian)IndonesianInupiatIranianIraqiIrishIroquoisIsraeliItalianJamaicanJapaneseJordanianKenyanKiowaKoreanLaotianLatvianLebaneseLiberianLithuanianLumbeeLuxembourgerMacedonianMalaysianMalteseMarshalleseMenomineeMexicanMexican American IndianMongolianMoroccanNative HawaiianNavajoNepaleseNew ZealanderNicaraguanNigerianNorthern EuropeanNorwegianOkinawanOsageOttawaPaiutePakistaniPalestinianPanamanianParaguayanPennsylvania GermanPeruvianPimaPolishPortuguesePotawatomiPuebloPuerto RicanPuget Sound SalishRomanianRussianSalvadoranSamoanScandinavianScotch-IrishScottishSeminoleSenegaleseSerbianShoshoneSierra LeoneanSiouxSlavicSlovakSloveneSomaliSouth AfricanSouth AmericanSouth American IndianSoviet UnionSpaniardSpanishSpanish AmericanSpanish American IndianSri LankanSubsaharan AfricanSudaneseSwedishSwissSyrianTaiwaneseThaiTlingit-HaidaTohono O'OdhamTonganTrinidadian and TobagonianTsimshianTurkishU.S. Virgin IslanderUgandanUkrainianUruguayanUteVenezuelanVietnameseWelshWest IndianYakamaYaquiYugoslavianYumanYup'ikZimbabwean
Immigration
NonimmigrantsImmigrantsAfghanistanAfricaAlbaniaArgentinaArmeniaAsiaAustraliaAustriaBahamasBangladeshBarbadosBelarusBelgiumBelizeBoliviaBosnia and HerzegovinaBrazilBulgariaBurma/MyanmarCabo VerdeCambodiaCameroonCanadaCaribbeanCentral AmericaChileChinaColombiaCongoCosta RicaCroatiaCubaCzechoslovakiaDenmarkDominicaDominican RepublicEastern AfricaEastern AsiaEastern EuropeEcuadorEgyptEl SalvadorEnglandEritreaEthiopiaEuropeFijiFranceGermanyGhanaGreeceGrenadaGuatemalaGuyanaHaitiHondurasHong KongHungaryIndiaIndonesiaIranIraqIrelandIsraelItalyJamaicaJapanJordanKazakhstanKenyaKoreaKuwaitLaosLatin AmericaLatviaLebanonLiberiaLithuaniaMalaysiaMexicoMicronesiaMiddle AfricaMoldovaMoroccoNepalNetherlandsNicaraguaNigeriaNorth AmericaNorth MacedoniaNorthern AfricaNorthern EuropeNorwayOceaniaPakistanPanamaPeruPhilippinesPolandPortugalRomaniaRussiaSaudi ArabiaScotlandSenegalSerbiaSierra LeoneSingaporeSomaliaSouth AfricaSouth AmericaSouth Central AsiaSouth Eastern AsiaSouthern EuropeSpainSri LankaSt. Vincent and the GrenadinesSudanSwedenSwitzerlandSyriaTaiwanThailandTrinidad and TobagoTurkeyUgandaUkraineUruguayUzbekistanVenezuelaVietnamWest IndiesWestern AfricaWestern AsiaWestern EuropeYemenZaireZimbabweAzores
Assyrian/Chaldean/Syriac
Race
Ancestry
AfghanAfricanAlaska NativeAlaskan AthabascanAlbanianAleutAlsatianAmericanApacheArabArapahoArgentineanArmenianAssyrian/Chaldean/SyriacAustralianAustrianBahamianBangladeshiBarbadianBasqueBelgianBelizeanBermudanBhutaneseBlackfeetBolivianBrazilianBritishBritish West IndianBulgarianBurmeseCajunCambodianCanadianCape VerdeanCarpatho RusynCelticCentral AmericanCentral American IndianCherokeeCheyenneChickasawChileanChineseChippewaChoctawColombianColvilleComancheCosta RicanCreeCreekCroatianCrowCubanCypriotCzechCzechoslovakianDanishDelawareDominicanDutchDutch West IndianEastern EuropeanEcuadorianEgyptianEnglishEstonianEthiopianEuropeanFijianFilipinoFinnishFrenchFrench American IndianFrench CanadianGermanGerman RussianGhanaianGreekGuamanian/ChamorroGuatemalanGuyaneseHaitianHmongHonduranHopiHoumaHungarianIcelanderIndian (Asian)IndonesianInupiatIranianIraqiIrishIroquoisIsraeliItalianJamaicanJapaneseJordanianKenyanKiowaKoreanLaotianLatvianLebaneseLiberianLithuanianLumbeeLuxembourgerMacedonianMalaysianMalteseMarshalleseMenomineeMexicanMexican American IndianMongolianMoroccanNative HawaiianNavajoNepaleseNew ZealanderNicaraguanNigerianNorthern EuropeanNorwegianOkinawanOsageOttawaPaiutePakistaniPalestinianPanamanianParaguayanPennsylvania GermanPeruvianPimaPolishPortuguesePotawatomiPuebloPuerto RicanPuget Sound SalishRomanianRussianSalvadoranSamoanScandinavianScotch-IrishScottishSeminoleSenegaleseSerbianShoshoneSierra LeoneanSiouxSlavicSlovakSomaliSouth AfricanSouth AmericanSouth American IndianSoviet UnionSpaniardSpanishSpanish AmericanSpanish American IndianSri LankanSubsaharan AfricanSudaneseSwedishSwissSyrianTaiwaneseThaiTlingit-HaidaTohono O'OdhamTonganTrinidadian and TobagonianTsimshianTurkishU.S. Virgin IslanderUgandanUkrainianUruguayanUteVenezuelanVietnameseWelshWest IndianYakamaYaquiYugoslavianYumanYup'ikZimbabwean
Immigration
NonimmigrantsImmigrantsAfghanistanAfricaAlbaniaArgentinaArmeniaAsiaAustraliaAustriaBahamasBangladeshBarbadosBelarusBelgiumBelizeBoliviaBosnia and HerzegovinaBrazilBulgariaBurma/MyanmarCabo VerdeCambodiaCameroonCanadaCaribbeanCentral AmericaChileChinaColombiaCongoCosta RicaCroatiaCubaCzechoslovakiaDenmarkDominicaDominican RepublicEastern AfricaEastern AsiaEastern EuropeEcuadorEgyptEl SalvadorEnglandEritreaEthiopiaEuropeFijiFranceGermanyGhanaGreeceGrenadaGuatemalaGuyanaHaitiHondurasHong KongHungaryIndiaIndonesiaIranIraqIrelandIsraelItalyJamaicaJapanJordanKazakhstanKenyaKoreaKuwaitLaosLatin AmericaLatviaLebanonLiberiaLithuaniaMalaysiaMexicoMicronesiaMiddle AfricaMoldovaMoroccoNepalNetherlandsNicaraguaNigeriaNorth AmericaNorth MacedoniaNorthern AfricaNorthern EuropeNorwayOceaniaPakistanPanamaPeruPhilippinesPolandPortugalRomaniaRussiaSaudi ArabiaScotlandSenegalSerbiaSierra LeoneSingaporeSomaliaSouth AfricaSouth AmericaSouth Central AsiaSouth Eastern AsiaSouthern EuropeSpainSri LankaSt. Vincent and the GrenadinesSudanSwedenSwitzerlandSyriaTaiwanThailandTrinidad and TobagoTurkeyUgandaUkraineUruguayUzbekistanVenezuelaVietnamWest IndiesWestern AfricaWestern AsiaWestern EuropeYemenZaireZimbabweAzores
Single Father Poverty
Income
Poverty
Unemployment
Labor Participation
Family Structure
Vehicle Availability
Education Level
Disability

Single Father Poverty Comparison

Slovenes

Assyrians/Chaldeans/Syriacs

Tragic
Exceptional
17.3%
SINGLE FATHER POVERTY
0.3/ 100
METRIC RATING
264th/ 347
METRIC RANK
11.7%
SINGLE FATHER POVERTY
100.0/ 100
METRIC RATING
1st/ 347
METRIC RANK

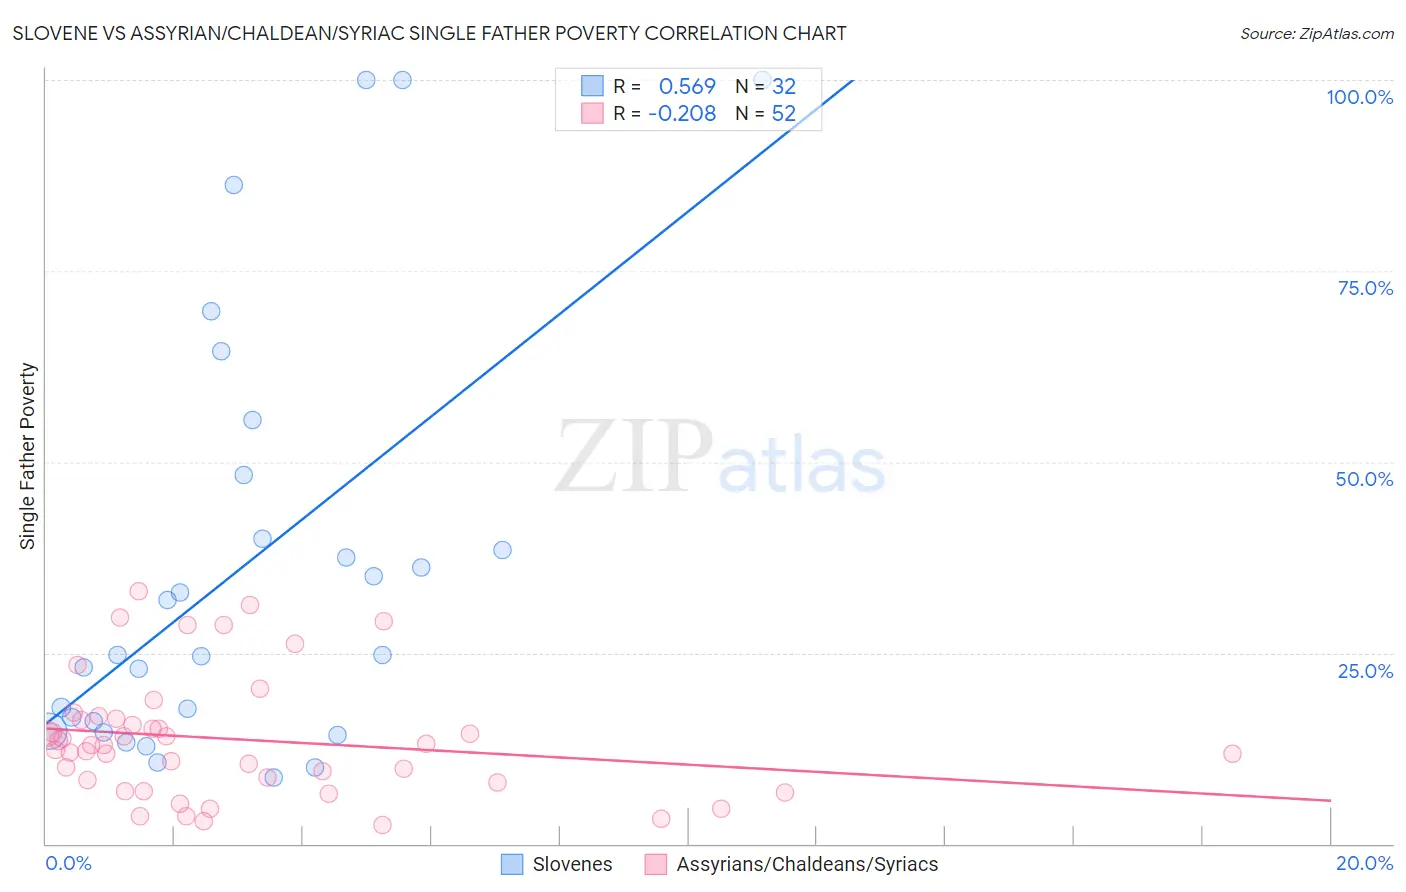
Slovene vs Assyrian/Chaldean/Syriac Single Father Poverty Correlation Chart

The statistical analysis conducted on geographies consisting of 209,649,531 people shows a substantial positive correlation between the proportion of Slovenes and poverty level among single fathers in the United States with a correlation coefficient (R) of 0.569 and weighted average of 17.3%. Similarly, the statistical analysis conducted on geographies consisting of 96,953,976 people shows a weak negative correlation between the proportion of Assyrians/Chaldeans/Syriacs and poverty level among single fathers in the United States with a correlation coefficient (R) of -0.208 and weighted average of 11.7%, a difference of 47.7%.
Slovene vs Assyrian/Chaldean/Syriac Single Father Poverty

Single Father Poverty Correlation Summary

MeasurementSloveneAssyrian/Chaldean/Syriac
Minimum8.6%2.4%
Maximum100.0%33.0%
Range91.4%30.5%
Mean36.3%13.7%
Median24.8%12.9%
Interquartile 25% (IQ1)15.4%8.2%
Interquartile 75% (IQ3)44.1%16.3%
Interquartile Range (IQR)28.7%8.1%
Standard Deviation (Sample)27.8%7.8%
Standard Deviation (Population)27.4%7.8%

Similar Demographics by Single Father Poverty

Demographics Similar to Slovenes by Single Father Poverty

In terms of single father poverty, the demographic groups most similar to Slovenes are Polish (17.3%, a difference of 0.0%), Jamaican (17.3%, a difference of 0.060%), Haitian (17.3%, a difference of 0.10%), Lithuanian (17.3%, a difference of 0.20%), and Immigrants from Caribbean (17.4%, a difference of 0.20%).
DemographicsRating | RankSingle Father Poverty
Immigrants | Albania
0.7
/100
|
#257
Tragic
17.2%
Albanians
0.7
/100
|
#258
Tragic
17.2%
Immigrants | Jamaica
0.7
/100
|
#259
Tragic
17.2%
Spaniards
0.6
/100
|
#260
Tragic
17.2%
Swiss
0.5
/100
|
#261
Tragic
17.3%
Immigrants | Zaire
0.4
/100
|
#262
Tragic
17.3%
Lithuanians
0.4
/100
|
#263
Tragic
17.3%
Slovenes
0.3
/100
|
#264
Tragic
17.3%
Poles
0.3
/100
|
#265
Tragic
17.3%
Jamaicans
0.3
/100
|
#266
Tragic
17.3%
Haitians
0.3
/100
|
#267
Tragic
17.3%
Immigrants | Caribbean
0.3
/100
|
#268
Tragic
17.4%
Slavs
0.3
/100
|
#269
Tragic
17.4%
Indonesians
0.2
/100
|
#270
Tragic
17.4%
French American Indians
0.2
/100
|
#271
Tragic
17.4%

Demographics Similar to Assyrians/Chaldeans/Syriacs by Single Father Poverty

In terms of single father poverty, the demographic groups most similar to Assyrians/Chaldeans/Syriacs are Tongan (12.2%, a difference of 4.2%), Tsimshian (12.7%, a difference of 8.3%), Immigrants from Fiji (13.2%, a difference of 12.8%), Immigrants from Ethiopia (13.4%, a difference of 14.6%), and Ethiopian (13.5%, a difference of 15.5%).
DemographicsRating | RankSingle Father Poverty
Assyrians/Chaldeans/Syriacs
100.0
/100
|
#1
Exceptional
11.7%
Tongans
100.0
/100
|
#2
Exceptional
12.2%
Tsimshian
100.0
/100
|
#3
Exceptional
12.7%
Immigrants | Fiji
100.0
/100
|
#4
Exceptional
13.2%
Immigrants | Ethiopia
100.0
/100
|
#5
Exceptional
13.4%
Ethiopians
100.0
/100
|
#6
Exceptional
13.5%
Immigrants | Taiwan
100.0
/100
|
#7
Exceptional
13.7%
Samoans
100.0
/100
|
#8
Exceptional
13.8%
Afghans
100.0
/100
|
#9
Exceptional
14.0%
Koreans
100.0
/100
|
#10
Exceptional
14.0%
Filipinos
100.0
/100
|
#11
Exceptional
14.0%
Immigrants | India
100.0
/100
|
#12
Exceptional
14.0%
Immigrants | Philippines
100.0
/100
|
#13
Exceptional
14.0%
Immigrants | Vietnam
100.0
/100
|
#14
Exceptional
14.1%
Sri Lankans
100.0
/100
|
#15
Exceptional
14.2%