Tohono O'odham vs Pennsylvania German Single Father Poverty
COMPARE
Tohono O'odham
Pennsylvania German
Single Father Poverty
Single Father Poverty Comparison
Tohono O'odham
Pennsylvania Germans
22.0%
SINGLE FATHER POVERTY
0.0/ 100
METRIC RATING
332nd/ 347
METRIC RANK
20.0%
SINGLE FATHER POVERTY
0.0/ 100
METRIC RATING
323rd/ 347
METRIC RANK
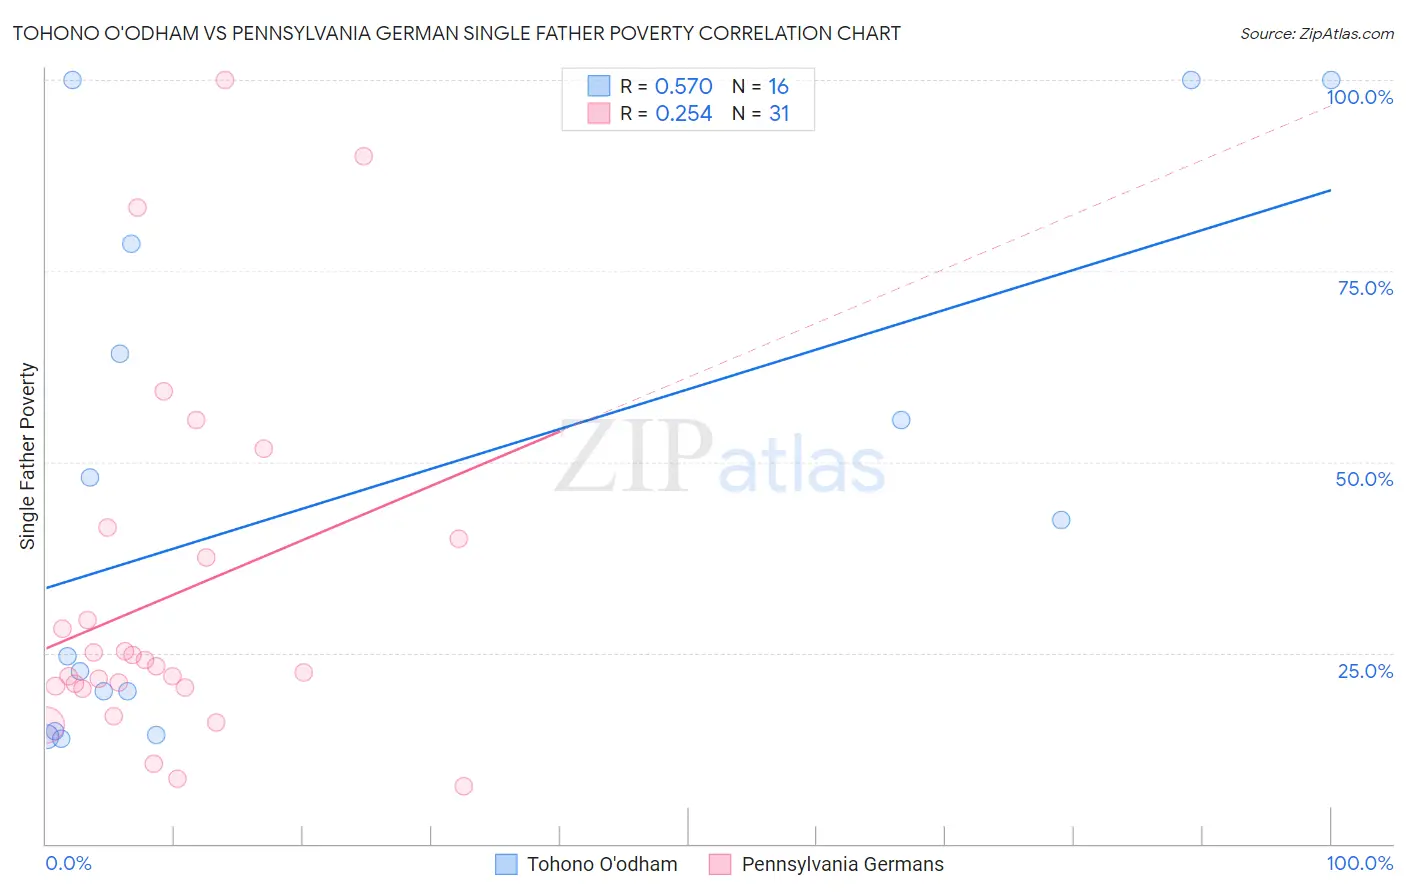
Tohono O'odham vs Pennsylvania German Single Father Poverty Correlation Chart
The statistical analysis conducted on geographies consisting of 55,933,384 people shows a substantial positive correlation between the proportion of Tohono O'odham and poverty level among single fathers in the United States with a correlation coefficient (R) of 0.570 and weighted average of 22.0%. Similarly, the statistical analysis conducted on geographies consisting of 194,261,919 people shows a weak positive correlation between the proportion of Pennsylvania Germans and poverty level among single fathers in the United States with a correlation coefficient (R) of 0.254 and weighted average of 20.0%, a difference of 10.0%.
Single Father Poverty Correlation Summary
| Measurement | Tohono O'odham | Pennsylvania German |
| Minimum | 13.8% | 7.5% |
| Maximum | 100.0% | 100.0% |
| Range | 86.2% | 92.5% |
| Mean | 45.8% | 32.4% |
| Median | 33.5% | 23.2% |
| Interquartile 25% (IQ1) | 17.4% | 20.4% |
| Interquartile 75% (IQ3) | 71.4% | 40.0% |
| Interquartile Range (IQR) | 54.0% | 19.6% |
| Standard Deviation (Sample) | 33.3% | 23.3% |
| Standard Deviation (Population) | 32.3% | 22.9% |
Demographics Similar to Tohono O'odham and Pennsylvania Germans by Single Father Poverty
In terms of single father poverty, the demographic groups most similar to Tohono O'odham are Central American Indian (21.7%, a difference of 1.5%), Native/Alaskan (22.4%, a difference of 1.7%), Paiute (21.6%, a difference of 1.8%), Kiowa (22.5%, a difference of 2.1%), and Colville (21.4%, a difference of 3.1%). Similarly, the demographic groups most similar to Pennsylvania Germans are American (20.1%, a difference of 0.22%), Creek (19.8%, a difference of 0.90%), Black/African American (20.4%, a difference of 1.8%), Cherokee (19.6%, a difference of 1.9%), and Inupiat (19.5%, a difference of 2.8%).
| Demographics | Rating | Rank | Single Father Poverty |
| Dominicans | 0.0 /100 | #317 | Tragic 19.1% |
| Dutch West Indians | 0.0 /100 | #318 | Tragic 19.2% |
| Slovaks | 0.0 /100 | #319 | Tragic 19.3% |
| Inupiat | 0.0 /100 | #320 | Tragic 19.5% |
| Cherokee | 0.0 /100 | #321 | Tragic 19.6% |
| Creek | 0.0 /100 | #322 | Tragic 19.8% |
| Pennsylvania Germans | 0.0 /100 | #323 | Tragic 20.0% |
| Americans | 0.0 /100 | #324 | Tragic 20.1% |
| Blacks/African Americans | 0.0 /100 | #325 | Tragic 20.4% |
| Immigrants | Yemen | 0.0 /100 | #326 | Tragic 20.6% |
| Choctaw | 0.0 /100 | #327 | Tragic 20.7% |
| Pueblo | 0.0 /100 | #328 | Tragic 21.1% |
| Colville | 0.0 /100 | #329 | Tragic 21.4% |
| Paiute | 0.0 /100 | #330 | Tragic 21.6% |
| Central American Indians | 0.0 /100 | #331 | Tragic 21.7% |
| Tohono O'odham | 0.0 /100 | #332 | Tragic 22.0% |
| Natives/Alaskans | 0.0 /100 | #333 | Tragic 22.4% |
| Kiowa | 0.0 /100 | #334 | Tragic 22.5% |
| Shoshone | 0.0 /100 | #335 | Tragic 22.9% |
| Cajuns | 0.0 /100 | #336 | Tragic 23.1% |
| Sioux | 0.0 /100 | #337 | Tragic 23.9% |