Tohono O'odham vs Spanish Single Father Poverty
COMPARE
Tohono O'odham
Spanish
Single Father Poverty
Single Father Poverty Comparison
Tohono O'odham
Spanish
22.0%
SINGLE FATHER POVERTY
0.0/ 100
METRIC RATING
332nd/ 347
METRIC RANK
16.7%
SINGLE FATHER POVERTY
10.7/ 100
METRIC RATING
214th/ 347
METRIC RANK
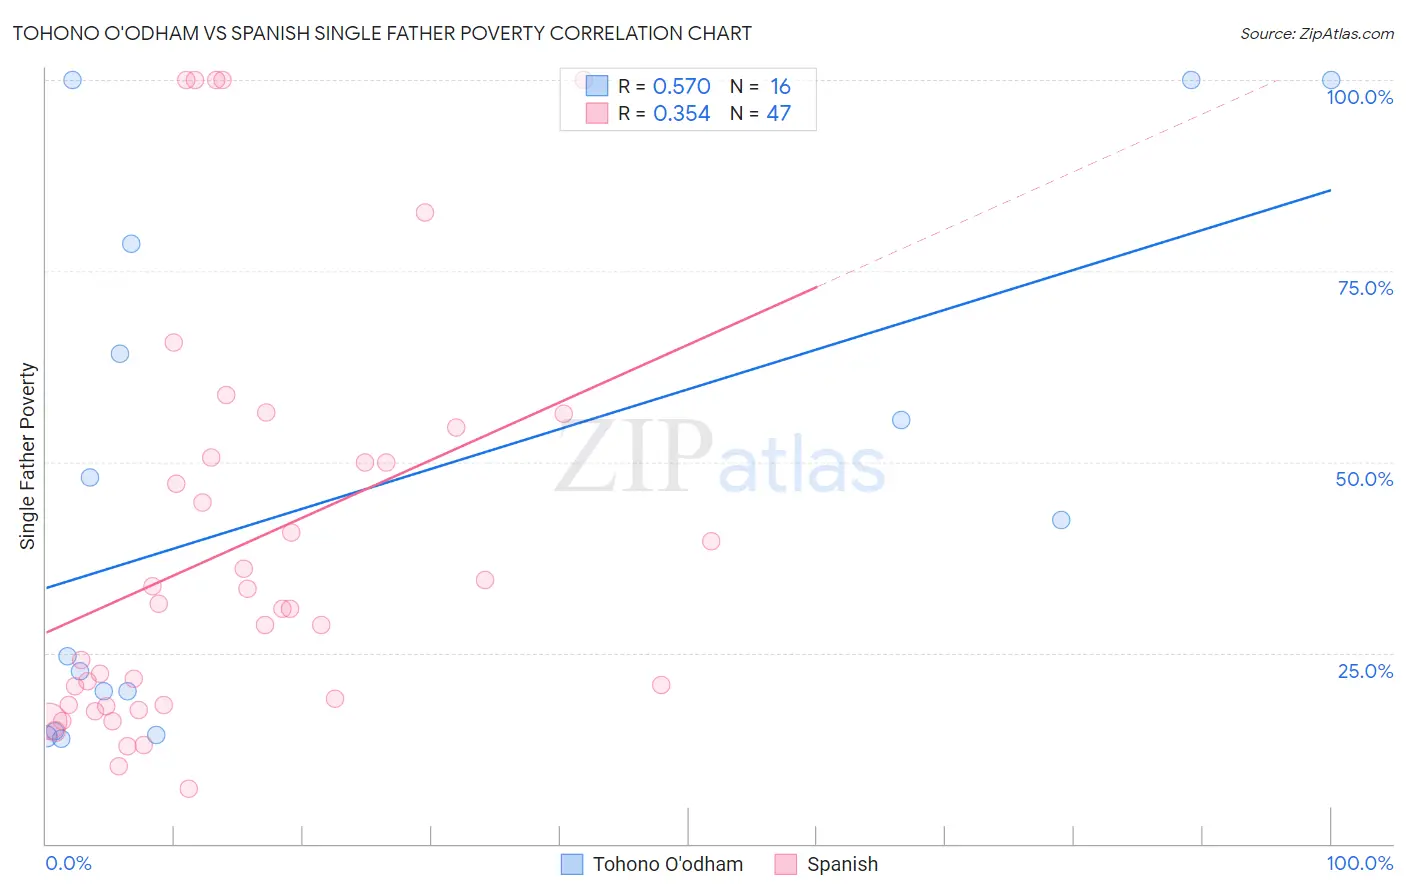
Tohono O'odham vs Spanish Single Father Poverty Correlation Chart
The statistical analysis conducted on geographies consisting of 55,933,384 people shows a substantial positive correlation between the proportion of Tohono O'odham and poverty level among single fathers in the United States with a correlation coefficient (R) of 0.570 and weighted average of 22.0%. Similarly, the statistical analysis conducted on geographies consisting of 330,244,668 people shows a mild positive correlation between the proportion of Spanish and poverty level among single fathers in the United States with a correlation coefficient (R) of 0.354 and weighted average of 16.7%, a difference of 32.0%.
Single Father Poverty Correlation Summary
| Measurement | Tohono O'odham | Spanish |
| Minimum | 13.8% | 7.2% |
| Maximum | 100.0% | 100.0% |
| Range | 86.2% | 92.8% |
| Mean | 45.8% | 38.9% |
| Median | 33.5% | 30.8% |
| Interquartile 25% (IQ1) | 17.4% | 18.1% |
| Interquartile 75% (IQ3) | 71.4% | 50.5% |
| Interquartile Range (IQR) | 54.0% | 32.4% |
| Standard Deviation (Sample) | 33.3% | 26.9% |
| Standard Deviation (Population) | 32.3% | 26.6% |
Similar Demographics by Single Father Poverty
Demographics Similar to Tohono O'odham by Single Father Poverty
In terms of single father poverty, the demographic groups most similar to Tohono O'odham are Central American Indian (21.7%, a difference of 1.5%), Native/Alaskan (22.4%, a difference of 1.7%), Paiute (21.6%, a difference of 1.8%), Kiowa (22.5%, a difference of 2.1%), and Colville (21.4%, a difference of 3.1%).
| Demographics | Rating | Rank | Single Father Poverty |
| Blacks/African Americans | 0.0 /100 | #325 | Tragic 20.4% |
| Immigrants | Yemen | 0.0 /100 | #326 | Tragic 20.6% |
| Choctaw | 0.0 /100 | #327 | Tragic 20.7% |
| Pueblo | 0.0 /100 | #328 | Tragic 21.1% |
| Colville | 0.0 /100 | #329 | Tragic 21.4% |
| Paiute | 0.0 /100 | #330 | Tragic 21.6% |
| Central American Indians | 0.0 /100 | #331 | Tragic 21.7% |
| Tohono O'odham | 0.0 /100 | #332 | Tragic 22.0% |
| Natives/Alaskans | 0.0 /100 | #333 | Tragic 22.4% |
| Kiowa | 0.0 /100 | #334 | Tragic 22.5% |
| Shoshone | 0.0 /100 | #335 | Tragic 22.9% |
| Cajuns | 0.0 /100 | #336 | Tragic 23.1% |
| Sioux | 0.0 /100 | #337 | Tragic 23.9% |
| Arapaho | 0.0 /100 | #338 | Tragic 24.0% |
| Apache | 0.0 /100 | #339 | Tragic 24.2% |
Demographics Similar to Spanish by Single Father Poverty
In terms of single father poverty, the demographic groups most similar to Spanish are Ghanaian (16.7%, a difference of 0.040%), Immigrants from Southern Europe (16.7%, a difference of 0.050%), Immigrants from Scotland (16.7%, a difference of 0.13%), Immigrants from England (16.7%, a difference of 0.14%), and Cheyenne (16.7%, a difference of 0.17%).
| Demographics | Rating | Rank | Single Father Poverty |
| New Zealanders | 13.7 /100 | #207 | Poor 16.6% |
| Eastern Europeans | 13.7 /100 | #208 | Poor 16.6% |
| Europeans | 13.2 /100 | #209 | Poor 16.6% |
| Guatemalans | 12.9 /100 | #210 | Poor 16.6% |
| Arabs | 12.8 /100 | #211 | Poor 16.6% |
| Immigrants | Southern Europe | 11.2 /100 | #212 | Poor 16.7% |
| Ghanaians | 11.0 /100 | #213 | Poor 16.7% |
| Spanish | 10.7 /100 | #214 | Poor 16.7% |
| Immigrants | Scotland | 9.6 /100 | #215 | Tragic 16.7% |
| Immigrants | England | 9.5 /100 | #216 | Tragic 16.7% |
| Cheyenne | 9.3 /100 | #217 | Tragic 16.7% |
| Immigrants | Uganda | 8.6 /100 | #218 | Tragic 16.7% |
| Immigrants | Ghana | 8.1 /100 | #219 | Tragic 16.7% |
| Immigrants | Denmark | 8.1 /100 | #220 | Tragic 16.7% |
| Immigrants | Greece | 8.1 /100 | #221 | Tragic 16.7% |