Tlingit-Haida vs Soviet Union Professional Degree

COMPARE

Tlingit-Haida
Race
Ancestry
AfghanAfricanAlaska NativeAlaskan AthabascanAlbanianAleutAlsatianAmericanApacheArabArapahoArgentineanArmenianAssyrian/Chaldean/SyriacAustralianAustrianBahamianBangladeshiBarbadianBasqueBelgianBelizeanBermudanBhutaneseBlackfeetBolivianBrazilianBritishBritish West IndianBulgarianBurmeseCajunCambodianCanadianCape VerdeanCarpatho RusynCelticCentral AmericanCentral American IndianCherokeeCheyenneChickasawChileanChineseChippewaChoctawColombianColvilleComancheCosta RicanCreeCreekCroatianCrowCubanCypriotCzechCzechoslovakianDanishDelawareDominicanDutchDutch West IndianEastern EuropeanEcuadorianEgyptianEnglishEstonianEthiopianEuropeanFijianFilipinoFinnishFrenchFrench American IndianFrench CanadianGermanGerman RussianGhanaianGreekGuamanian/ChamorroGuatemalanGuyaneseHaitianHmongHonduranHopiHoumaHungarianIcelanderIndian (Asian)IndonesianInupiatIranianIraqiIrishIroquoisIsraeliItalianJamaicanJapaneseJordanianKenyanKiowaKoreanLaotianLatvianLebaneseLiberianLithuanianLumbeeLuxembourgerMacedonianMalaysianMalteseMarshalleseMenomineeMexicanMexican American IndianMongolianMoroccanNative HawaiianNavajoNepaleseNew ZealanderNicaraguanNigerianNorthern EuropeanNorwegianOkinawanOsageOttawaPaiutePakistaniPalestinianPanamanianParaguayanPennsylvania GermanPeruvianPimaPolishPortuguesePotawatomiPuebloPuerto RicanPuget Sound SalishRomanianRussianSalvadoranSamoanScandinavianScotch-IrishScottishSeminoleSenegaleseSerbianShoshoneSierra LeoneanSiouxSlavicSlovakSloveneSomaliSouth AfricanSouth AmericanSouth American IndianSpaniardSpanishSpanish AmericanSpanish American IndianSri LankanSubsaharan AfricanSudaneseSwedishSwissSyrianTaiwaneseThaiTlingit-HaidaTohono O'OdhamTonganTrinidadian and TobagonianTsimshianTurkishU.S. Virgin IslanderUgandanUkrainianUruguayanUteVenezuelanVietnameseWelshWest IndianYakamaYaquiYugoslavianYumanYup'ikZimbabwean
Immigration
NonimmigrantsImmigrantsAfghanistanAfricaAlbaniaArgentinaArmeniaAsiaAustraliaAustriaBahamasBangladeshBarbadosBelarusBelgiumBelizeBoliviaBosnia and HerzegovinaBrazilBulgariaBurma/MyanmarCabo VerdeCambodiaCameroonCanadaCaribbeanCentral AmericaChileChinaColombiaCongoCosta RicaCroatiaCubaCzechoslovakiaDenmarkDominicaDominican RepublicEastern AfricaEastern AsiaEastern EuropeEcuadorEgyptEl SalvadorEnglandEritreaEthiopiaEuropeFijiFranceGermanyGhanaGreeceGrenadaGuatemalaGuyanaHaitiHondurasHong KongHungaryIndiaIndonesiaIranIraqIrelandIsraelItalyJamaicaJapanJordanKazakhstanKenyaKoreaKuwaitLaosLatin AmericaLatviaLebanonLiberiaLithuaniaMalaysiaMexicoMicronesiaMiddle AfricaMoldovaMoroccoNepalNetherlandsNicaraguaNigeriaNorth AmericaNorth MacedoniaNorthern AfricaNorthern EuropeNorwayOceaniaPakistanPanamaPeruPhilippinesPolandPortugalRomaniaRussiaSaudi ArabiaScotlandSenegalSerbiaSierra LeoneSingaporeSomaliaSouth AfricaSouth AmericaSouth Central AsiaSouth Eastern AsiaSouthern EuropeSpainSri LankaSt. Vincent and the GrenadinesSudanSwedenSwitzerlandSyriaTaiwanThailandTrinidad and TobagoTurkeyUgandaUkraineUruguayUzbekistanVenezuelaVietnamWest IndiesWestern AfricaWestern AsiaWestern EuropeYemenZaireZimbabweAzores
Soviet Union
Race
Ancestry
AfghanAfricanAlaska NativeAlaskan AthabascanAlbanianAleutAlsatianAmericanApacheArabArapahoArgentineanArmenianAssyrian/Chaldean/SyriacAustralianAustrianBahamianBangladeshiBarbadianBasqueBelgianBelizeanBermudanBhutaneseBlackfeetBolivianBrazilianBritishBritish West IndianBulgarianBurmeseCajunCambodianCanadianCape VerdeanCarpatho RusynCelticCentral AmericanCentral American IndianCherokeeCheyenneChickasawChileanChineseChippewaChoctawColombianColvilleComancheCosta RicanCreeCreekCroatianCrowCubanCypriotCzechCzechoslovakianDanishDelawareDominicanDutchDutch West IndianEastern EuropeanEcuadorianEgyptianEnglishEstonianEthiopianEuropeanFijianFilipinoFinnishFrenchFrench American IndianFrench CanadianGermanGerman RussianGhanaianGreekGuamanian/ChamorroGuatemalanGuyaneseHaitianHmongHonduranHopiHoumaHungarianIcelanderIndian (Asian)IndonesianInupiatIranianIraqiIrishIroquoisIsraeliItalianJamaicanJapaneseJordanianKenyanKiowaKoreanLaotianLatvianLebaneseLiberianLithuanianLumbeeLuxembourgerMacedonianMalaysianMalteseMarshalleseMenomineeMexicanMexican American IndianMongolianMoroccanNative HawaiianNavajoNepaleseNew ZealanderNicaraguanNigerianNorthern EuropeanNorwegianOkinawanOsageOttawaPaiutePakistaniPalestinianPanamanianParaguayanPennsylvania GermanPeruvianPimaPolishPortuguesePotawatomiPuebloPuerto RicanPuget Sound SalishRomanianRussianSalvadoranSamoanScandinavianScotch-IrishScottishSeminoleSenegaleseSerbianShoshoneSierra LeoneanSiouxSlavicSlovakSloveneSomaliSouth AfricanSouth AmericanSouth American IndianSoviet UnionSpaniardSpanishSpanish AmericanSpanish American IndianSri LankanSubsaharan AfricanSudaneseSwedishSwissSyrianTaiwaneseThaiTohono O'OdhamTonganTrinidadian and TobagonianTsimshianTurkishU.S. Virgin IslanderUgandanUkrainianUruguayanUteVenezuelanVietnameseWelshWest IndianYakamaYaquiYugoslavianYumanYup'ikZimbabwean
Immigration
NonimmigrantsImmigrantsAfghanistanAfricaAlbaniaArgentinaArmeniaAsiaAustraliaAustriaBahamasBangladeshBarbadosBelarusBelgiumBelizeBoliviaBosnia and HerzegovinaBrazilBulgariaBurma/MyanmarCabo VerdeCambodiaCameroonCanadaCaribbeanCentral AmericaChileChinaColombiaCongoCosta RicaCroatiaCubaCzechoslovakiaDenmarkDominicaDominican RepublicEastern AfricaEastern AsiaEastern EuropeEcuadorEgyptEl SalvadorEnglandEritreaEthiopiaEuropeFijiFranceGermanyGhanaGreeceGrenadaGuatemalaGuyanaHaitiHondurasHong KongHungaryIndiaIndonesiaIranIraqIrelandIsraelItalyJamaicaJapanJordanKazakhstanKenyaKoreaKuwaitLaosLatin AmericaLatviaLebanonLiberiaLithuaniaMalaysiaMexicoMicronesiaMiddle AfricaMoldovaMoroccoNepalNetherlandsNicaraguaNigeriaNorth AmericaNorth MacedoniaNorthern AfricaNorthern EuropeNorwayOceaniaPakistanPanamaPeruPhilippinesPolandPortugalRomaniaRussiaSaudi ArabiaScotlandSenegalSerbiaSierra LeoneSingaporeSomaliaSouth AfricaSouth AmericaSouth Central AsiaSouth Eastern AsiaSouthern EuropeSpainSri LankaSt. Vincent and the GrenadinesSudanSwedenSwitzerlandSyriaTaiwanThailandTrinidad and TobagoTurkeyUgandaUkraineUruguayUzbekistanVenezuelaVietnamWest IndiesWestern AfricaWestern AsiaWestern EuropeYemenZaireZimbabweAzores
Professional Degree
Income
Poverty
Unemployment
Labor Participation
Family Structure
Vehicle Availability
Education Level
Disability

Professional Degree Comparison

Tlingit-Haida

Soviet Union

Tragic
Exceptional
4.0%
PROFESSIONAL DEGREE
6.9/ 100
METRIC RATING
225th/ 347
METRIC RANK
6.6%
PROFESSIONAL DEGREE
100.0/ 100
METRIC RATING
18th/ 347
METRIC RANK

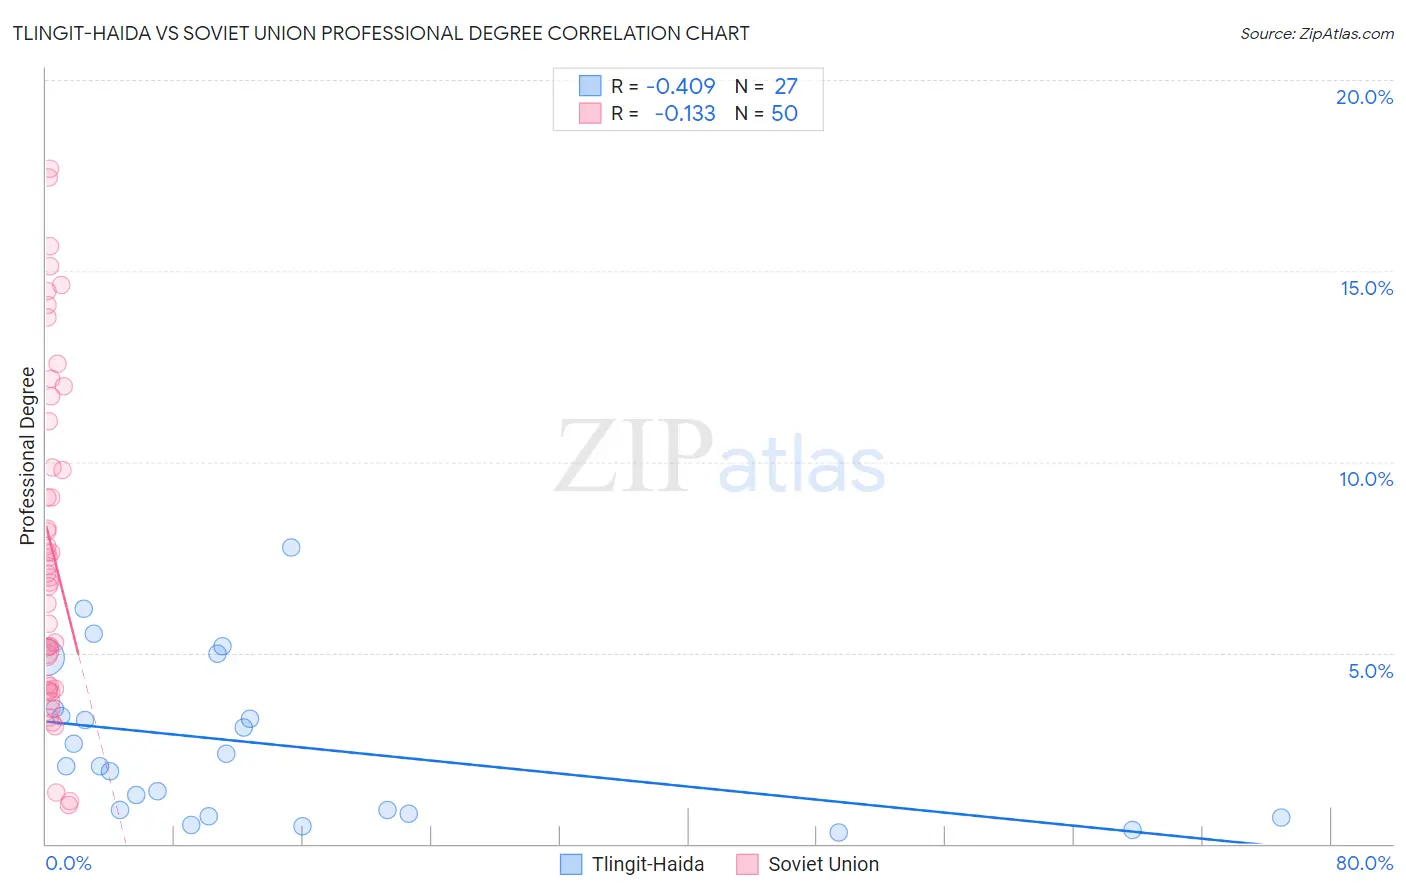
Tlingit-Haida vs Soviet Union Professional Degree Correlation Chart

The statistical analysis conducted on geographies consisting of 60,804,228 people shows a moderate negative correlation between the proportion of Tlingit-Haida and percentage of population with at least professional degree education in the United States with a correlation coefficient (R) of -0.409 and weighted average of 4.0%. Similarly, the statistical analysis conducted on geographies consisting of 43,509,630 people shows a poor negative correlation between the proportion of Soviet Union and percentage of population with at least professional degree education in the United States with a correlation coefficient (R) of -0.133 and weighted average of 6.6%, a difference of 64.5%.
Tlingit-Haida vs Soviet Union Professional Degree

Professional Degree Correlation Summary

MeasurementTlingit-HaidaSoviet Union
Minimum0.29%1.0%
Maximum7.8%17.7%
Range7.5%16.7%
Mean2.6%7.8%
Median2.0%7.0%
Interquartile 25% (IQ1)0.79%4.1%
Interquartile 75% (IQ3)3.5%11.1%
Interquartile Range (IQR)2.7%6.9%
Standard Deviation (Sample)2.0%4.4%
Standard Deviation (Population)2.0%4.3%

Similar Demographics by Professional Degree

Demographics Similar to Tlingit-Haida by Professional Degree

In terms of professional degree, the demographic groups most similar to Tlingit-Haida are Trinidadian and Tobagonian (4.0%, a difference of 0.13%), Immigrants from Bosnia and Herzegovina (4.0%, a difference of 0.27%), Immigrants from Western Africa (4.0%, a difference of 0.35%), German Russian (4.0%, a difference of 0.55%), and French Canadian (4.0%, a difference of 0.60%).
DemographicsRating | RankProfessional Degree
Dutch
9.0
/100
|
#218
Tragic
4.0%
Immigrants | South Eastern Asia
8.9
/100
|
#219
Tragic
4.0%
Ute
8.2
/100
|
#220
Tragic
4.0%
French Canadians
8.0
/100
|
#221
Tragic
4.0%
Immigrants | Western Africa
7.5
/100
|
#222
Tragic
4.0%
Immigrants | Bosnia and Herzegovina
7.4
/100
|
#223
Tragic
4.0%
Trinidadians and Tobagonians
7.1
/100
|
#224
Tragic
4.0%
Tlingit-Haida
6.9
/100
|
#225
Tragic
4.0%
German Russians
6.1
/100
|
#226
Tragic
4.0%
Cubans
5.9
/100
|
#227
Tragic
4.0%
Immigrants | West Indies
5.6
/100
|
#228
Tragic
4.0%
Immigrants | Burma/Myanmar
5.4
/100
|
#229
Tragic
3.9%
Nicaraguans
5.1
/100
|
#230
Tragic
3.9%
Ecuadorians
4.6
/100
|
#231
Tragic
3.9%
Cree
4.3
/100
|
#232
Tragic
3.9%

Demographics Similar to Soviet Union by Professional Degree

In terms of professional degree, the demographic groups most similar to Soviet Union are Immigrants from Eastern Asia (6.6%, a difference of 0.020%), Indian (Asian) (6.5%, a difference of 0.66%), Immigrants from Sweden (6.7%, a difference of 2.0%), Immigrants from Denmark (6.4%, a difference of 2.2%), and Immigrants from Hong Kong (6.4%, a difference of 2.4%).
DemographicsRating | RankProfessional Degree
Cypriots
100.0
/100
|
#11
Exceptional
6.9%
Israelis
100.0
/100
|
#12
Exceptional
6.9%
Immigrants | Australia
100.0
/100
|
#13
Exceptional
6.9%
Immigrants | France
100.0
/100
|
#14
Exceptional
6.8%
Immigrants | China
100.0
/100
|
#15
Exceptional
6.7%
Immigrants | Sweden
100.0
/100
|
#16
Exceptional
6.7%
Immigrants | Eastern Asia
100.0
/100
|
#17
Exceptional
6.6%
Soviet Union
100.0
/100
|
#18
Exceptional
6.6%
Indians (Asian)
100.0
/100
|
#19
Exceptional
6.5%
Immigrants | Denmark
100.0
/100
|
#20
Exceptional
6.4%
Immigrants | Hong Kong
100.0
/100
|
#21
Exceptional
6.4%
Immigrants | Japan
100.0
/100
|
#22
Exceptional
6.4%
Russians
100.0
/100
|
#23
Exceptional
6.3%
Immigrants | Spain
100.0
/100
|
#24
Exceptional
6.3%
Immigrants | Ireland
100.0
/100
|
#25
Exceptional
6.3%