Eastern European vs Soviet Union Single Father Poverty
COMPARE
Eastern European
Soviet Union
Single Father Poverty
Single Father Poverty Comparison
Eastern Europeans
Soviet Union
16.6%
SINGLE FATHER POVERTY
13.7/ 100
METRIC RATING
208th/ 347
METRIC RANK
14.3%
SINGLE FATHER POVERTY
100.0/ 100
METRIC RATING
18th/ 347
METRIC RANK
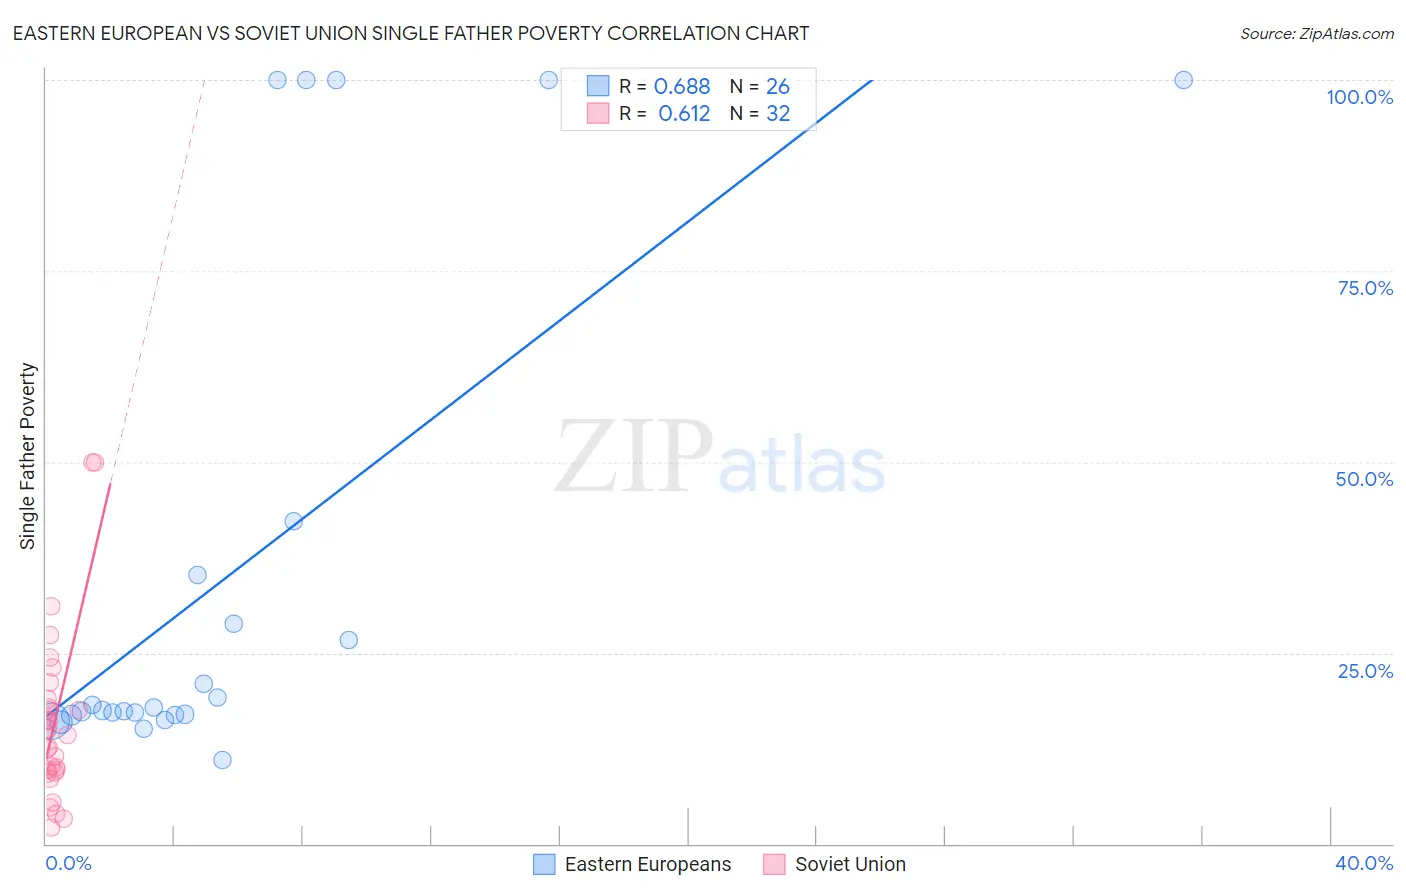
Eastern European vs Soviet Union Single Father Poverty Correlation Chart
The statistical analysis conducted on geographies consisting of 345,248,762 people shows a significant positive correlation between the proportion of Eastern Europeans and poverty level among single fathers in the United States with a correlation coefficient (R) of 0.688 and weighted average of 16.6%. Similarly, the statistical analysis conducted on geographies consisting of 41,440,473 people shows a significant positive correlation between the proportion of Soviet Union and poverty level among single fathers in the United States with a correlation coefficient (R) of 0.612 and weighted average of 14.3%, a difference of 16.7%.
Single Father Poverty Correlation Summary
| Measurement | Eastern European | Soviet Union |
| Minimum | 10.9% | 2.1% |
| Maximum | 100.0% | 50.0% |
| Range | 89.1% | 47.9% |
| Mean | 35.4% | 16.1% |
| Median | 17.6% | 14.6% |
| Interquartile 25% (IQ1) | 16.9% | 9.5% |
| Interquartile 75% (IQ3) | 35.2% | 18.4% |
| Interquartile Range (IQR) | 18.4% | 8.9% |
| Standard Deviation (Sample) | 32.8% | 11.2% |
| Standard Deviation (Population) | 32.2% | 11.1% |
Similar Demographics by Single Father Poverty
Demographics Similar to Eastern Europeans by Single Father Poverty
In terms of single father poverty, the demographic groups most similar to Eastern Europeans are Immigrants from Senegal (16.6%, a difference of 0.0%), New Zealander (16.6%, a difference of 0.0%), European (16.6%, a difference of 0.040%), Venezuelan (16.6%, a difference of 0.050%), and Guatemalan (16.6%, a difference of 0.070%).
| Demographics | Rating | Rank | Single Father Poverty |
| Cubans | 16.5 /100 | #201 | Poor 16.6% |
| Immigrants | Croatia | 16.5 /100 | #202 | Poor 16.6% |
| Immigrants | North America | 15.1 /100 | #203 | Poor 16.6% |
| Immigrants | Guatemala | 14.8 /100 | #204 | Poor 16.6% |
| Venezuelans | 14.3 /100 | #205 | Poor 16.6% |
| Immigrants | Senegal | 13.7 /100 | #206 | Poor 16.6% |
| New Zealanders | 13.7 /100 | #207 | Poor 16.6% |
| Eastern Europeans | 13.7 /100 | #208 | Poor 16.6% |
| Europeans | 13.2 /100 | #209 | Poor 16.6% |
| Guatemalans | 12.9 /100 | #210 | Poor 16.6% |
| Arabs | 12.8 /100 | #211 | Poor 16.6% |
| Immigrants | Southern Europe | 11.2 /100 | #212 | Poor 16.7% |
| Ghanaians | 11.0 /100 | #213 | Poor 16.7% |
| Spanish | 10.7 /100 | #214 | Poor 16.7% |
| Immigrants | Scotland | 9.6 /100 | #215 | Tragic 16.7% |
Demographics Similar to Soviet Union by Single Father Poverty
In terms of single father poverty, the demographic groups most similar to Soviet Union are Immigrants from Hong Kong (14.2%, a difference of 0.030%), Immigrants from Iraq (14.3%, a difference of 0.040%), Immigrants from Singapore (14.3%, a difference of 0.090%), Immigrants from Afghanistan (14.3%, a difference of 0.18%), and Immigrants from Iran (14.2%, a difference of 0.48%).
| Demographics | Rating | Rank | Single Father Poverty |
| Filipinos | 100.0 /100 | #11 | Exceptional 14.0% |
| Immigrants | India | 100.0 /100 | #12 | Exceptional 14.0% |
| Immigrants | Philippines | 100.0 /100 | #13 | Exceptional 14.0% |
| Immigrants | Vietnam | 100.0 /100 | #14 | Exceptional 14.1% |
| Sri Lankans | 100.0 /100 | #15 | Exceptional 14.2% |
| Immigrants | Iran | 100.0 /100 | #16 | Exceptional 14.2% |
| Immigrants | Hong Kong | 100.0 /100 | #17 | Exceptional 14.2% |
| Soviet Union | 100.0 /100 | #18 | Exceptional 14.3% |
| Immigrants | Iraq | 100.0 /100 | #19 | Exceptional 14.3% |
| Immigrants | Singapore | 100.0 /100 | #20 | Exceptional 14.3% |
| Immigrants | Afghanistan | 100.0 /100 | #21 | Exceptional 14.3% |
| Taiwanese | 100.0 /100 | #22 | Exceptional 14.3% |
| Immigrants | Egypt | 100.0 /100 | #23 | Exceptional 14.4% |
| Immigrants | South Eastern Asia | 100.0 /100 | #24 | Exceptional 14.4% |
| Iranians | 100.0 /100 | #25 | Exceptional 14.4% |