Sierra Leonean vs Slavic Single Father Poverty
COMPARE
Sierra Leonean
Slavic
Single Father Poverty
Single Father Poverty Comparison
Sierra Leoneans
Slavs
17.2%
SINGLE FATHER POVERTY
0.8/ 100
METRIC RATING
255th/ 347
METRIC RANK
17.4%
SINGLE FATHER POVERTY
0.3/ 100
METRIC RATING
269th/ 347
METRIC RANK
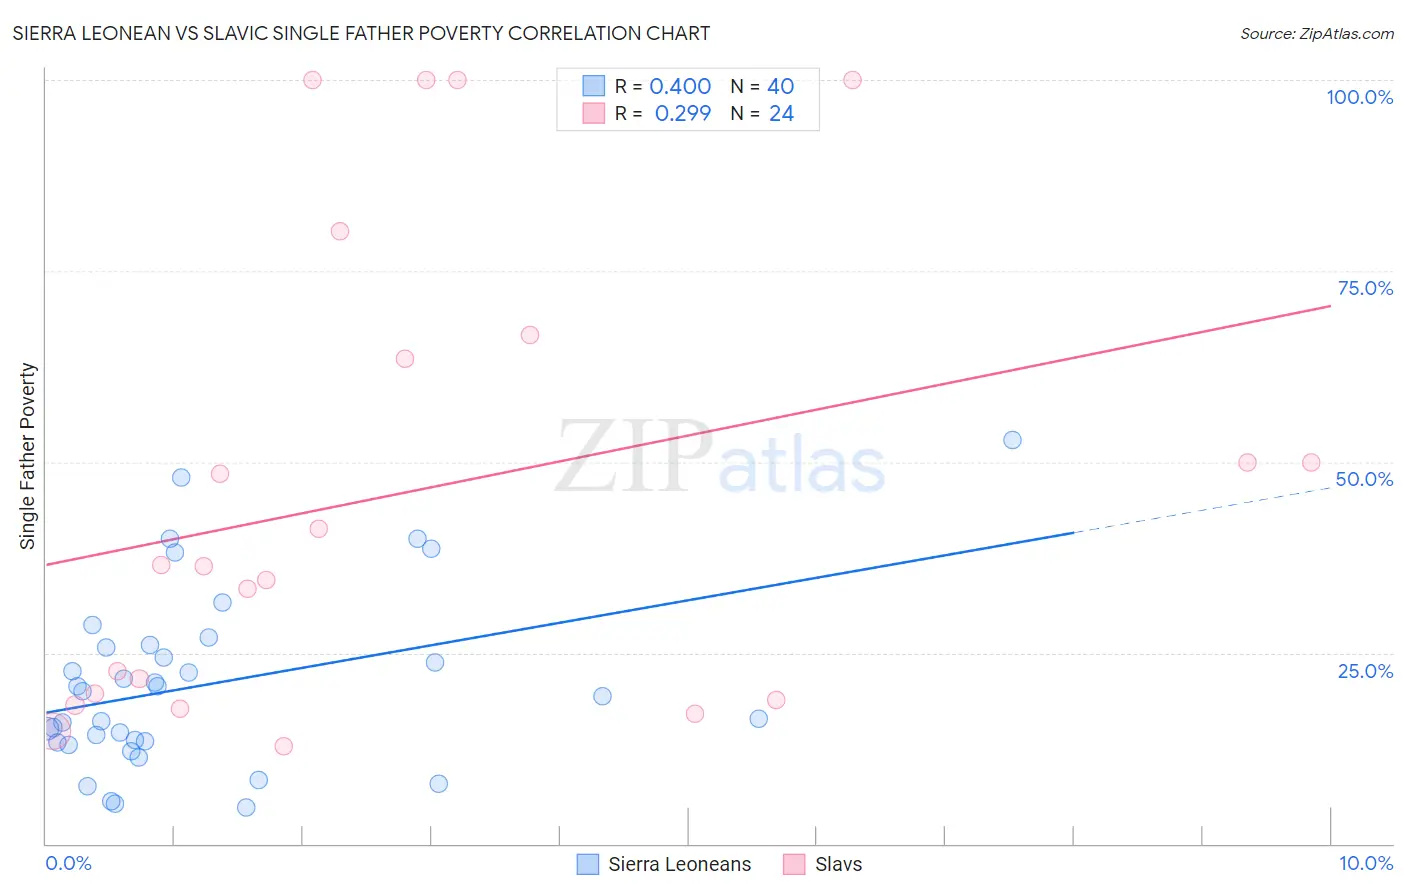
Sierra Leonean vs Slavic Single Father Poverty Correlation Chart
The statistical analysis conducted on geographies consisting of 77,262,166 people shows a mild positive correlation between the proportion of Sierra Leoneans and poverty level among single fathers in the United States with a correlation coefficient (R) of 0.400 and weighted average of 17.2%. Similarly, the statistical analysis conducted on geographies consisting of 218,860,364 people shows a weak positive correlation between the proportion of Slavs and poverty level among single fathers in the United States with a correlation coefficient (R) of 0.299 and weighted average of 17.4%, a difference of 1.1%.
Single Father Poverty Correlation Summary
| Measurement | Sierra Leonean | Slavic |
| Minimum | 4.8% | 12.8% |
| Maximum | 52.9% | 100.0% |
| Range | 48.2% | 87.2% |
| Mean | 20.9% | 46.0% |
| Median | 19.7% | 36.4% |
| Interquartile 25% (IQ1) | 13.4% | 19.2% |
| Interquartile 75% (IQ3) | 25.9% | 65.1% |
| Interquartile Range (IQR) | 12.5% | 45.9% |
| Standard Deviation (Sample) | 11.6% | 30.4% |
| Standard Deviation (Population) | 11.5% | 29.7% |
Demographics Similar to Sierra Leoneans and Slavs by Single Father Poverty
In terms of single father poverty, the demographic groups most similar to Sierra Leoneans are Immigrants from Haiti (17.2%, a difference of 0.010%), Immigrants from Albania (17.2%, a difference of 0.090%), Albanian (17.2%, a difference of 0.11%), Immigrants from Jamaica (17.2%, a difference of 0.14%), and Immigrants from Honduras (17.1%, a difference of 0.17%). Similarly, the demographic groups most similar to Slavs are Immigrants from Caribbean (17.4%, a difference of 0.070%), Haitian (17.3%, a difference of 0.17%), Jamaican (17.3%, a difference of 0.21%), Polish (17.3%, a difference of 0.26%), and Indonesian (17.4%, a difference of 0.26%).
| Demographics | Rating | Rank | Single Father Poverty |
| Croatians | 1.0 /100 | #252 | Tragic 17.1% |
| Cree | 1.0 /100 | #253 | Tragic 17.1% |
| Immigrants | Honduras | 0.9 /100 | #254 | Tragic 17.1% |
| Sierra Leoneans | 0.8 /100 | #255 | Tragic 17.2% |
| Immigrants | Haiti | 0.8 /100 | #256 | Tragic 17.2% |
| Immigrants | Albania | 0.7 /100 | #257 | Tragic 17.2% |
| Albanians | 0.7 /100 | #258 | Tragic 17.2% |
| Immigrants | Jamaica | 0.7 /100 | #259 | Tragic 17.2% |
| Spaniards | 0.6 /100 | #260 | Tragic 17.2% |
| Swiss | 0.5 /100 | #261 | Tragic 17.3% |
| Immigrants | Zaire | 0.4 /100 | #262 | Tragic 17.3% |
| Lithuanians | 0.4 /100 | #263 | Tragic 17.3% |
| Slovenes | 0.3 /100 | #264 | Tragic 17.3% |
| Poles | 0.3 /100 | #265 | Tragic 17.3% |
| Jamaicans | 0.3 /100 | #266 | Tragic 17.3% |
| Haitians | 0.3 /100 | #267 | Tragic 17.3% |
| Immigrants | Caribbean | 0.3 /100 | #268 | Tragic 17.4% |
| Slavs | 0.3 /100 | #269 | Tragic 17.4% |
| Indonesians | 0.2 /100 | #270 | Tragic 17.4% |
| French American Indians | 0.2 /100 | #271 | Tragic 17.4% |
| Barbadians | 0.1 /100 | #272 | Tragic 17.5% |