Immigrants from Scotland vs Slavic Single Father Poverty
COMPARE
Immigrants from Scotland
Slavic
Single Father Poverty
Single Father Poverty Comparison
Immigrants from Scotland
Slavs
16.7%
SINGLE FATHER POVERTY
9.6/ 100
METRIC RATING
215th/ 347
METRIC RANK
17.4%
SINGLE FATHER POVERTY
0.3/ 100
METRIC RATING
269th/ 347
METRIC RANK
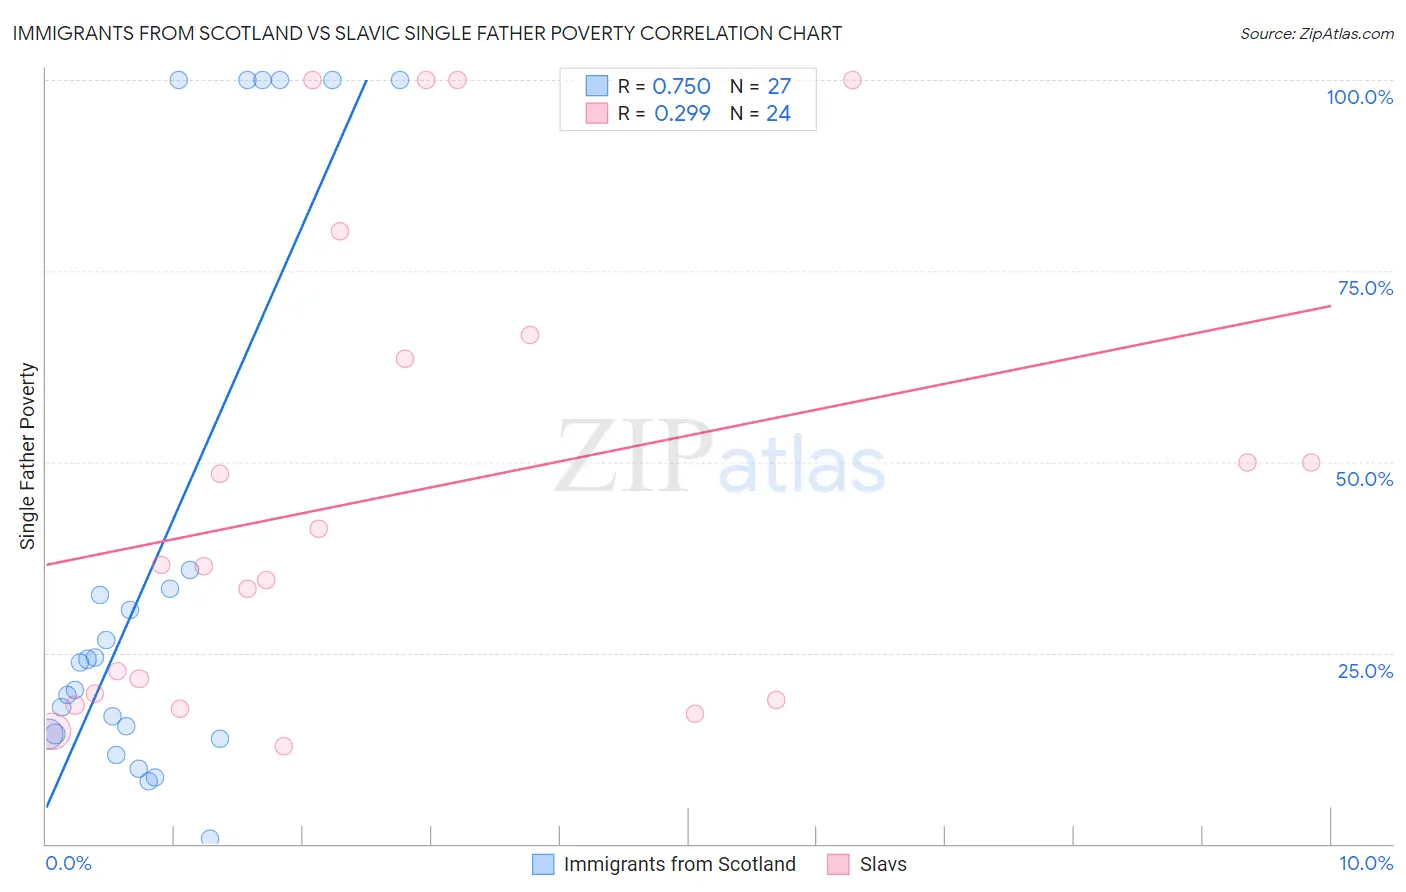
Immigrants from Scotland vs Slavic Single Father Poverty Correlation Chart
The statistical analysis conducted on geographies consisting of 163,789,782 people shows a strong positive correlation between the proportion of Immigrants from Scotland and poverty level among single fathers in the United States with a correlation coefficient (R) of 0.750 and weighted average of 16.7%. Similarly, the statistical analysis conducted on geographies consisting of 218,860,364 people shows a weak positive correlation between the proportion of Slavs and poverty level among single fathers in the United States with a correlation coefficient (R) of 0.299 and weighted average of 17.4%, a difference of 4.0%.
Single Father Poverty Correlation Summary
| Measurement | Immigrants from Scotland | Slavic |
| Minimum | 0.70% | 12.8% |
| Maximum | 100.0% | 100.0% |
| Range | 99.3% | 87.2% |
| Mean | 37.1% | 46.0% |
| Median | 23.7% | 36.4% |
| Interquartile 25% (IQ1) | 14.3% | 19.2% |
| Interquartile 75% (IQ3) | 35.9% | 65.1% |
| Interquartile Range (IQR) | 21.6% | 45.9% |
| Standard Deviation (Sample) | 35.2% | 30.4% |
| Standard Deviation (Population) | 34.6% | 29.7% |
Similar Demographics by Single Father Poverty
Demographics Similar to Immigrants from Scotland by Single Father Poverty
In terms of single father poverty, the demographic groups most similar to Immigrants from Scotland are Immigrants from England (16.7%, a difference of 0.0%), Cheyenne (16.7%, a difference of 0.030%), Spanish (16.7%, a difference of 0.13%), Immigrants from Uganda (16.7%, a difference of 0.13%), and Ghanaian (16.7%, a difference of 0.17%).
| Demographics | Rating | Rank | Single Father Poverty |
| Eastern Europeans | 13.7 /100 | #208 | Poor 16.6% |
| Europeans | 13.2 /100 | #209 | Poor 16.6% |
| Guatemalans | 12.9 /100 | #210 | Poor 16.6% |
| Arabs | 12.8 /100 | #211 | Poor 16.6% |
| Immigrants | Southern Europe | 11.2 /100 | #212 | Poor 16.7% |
| Ghanaians | 11.0 /100 | #213 | Poor 16.7% |
| Spanish | 10.7 /100 | #214 | Poor 16.7% |
| Immigrants | Scotland | 9.6 /100 | #215 | Tragic 16.7% |
| Immigrants | England | 9.5 /100 | #216 | Tragic 16.7% |
| Cheyenne | 9.3 /100 | #217 | Tragic 16.7% |
| Immigrants | Uganda | 8.6 /100 | #218 | Tragic 16.7% |
| Immigrants | Ghana | 8.1 /100 | #219 | Tragic 16.7% |
| Immigrants | Denmark | 8.1 /100 | #220 | Tragic 16.7% |
| Immigrants | Greece | 8.1 /100 | #221 | Tragic 16.7% |
| Immigrants | Spain | 8.0 /100 | #222 | Tragic 16.7% |
Demographics Similar to Slavs by Single Father Poverty
In terms of single father poverty, the demographic groups most similar to Slavs are Immigrants from Caribbean (17.4%, a difference of 0.070%), Haitian (17.3%, a difference of 0.17%), Jamaican (17.3%, a difference of 0.21%), Polish (17.3%, a difference of 0.26%), and Indonesian (17.4%, a difference of 0.26%).
| Demographics | Rating | Rank | Single Father Poverty |
| Immigrants | Zaire | 0.4 /100 | #262 | Tragic 17.3% |
| Lithuanians | 0.4 /100 | #263 | Tragic 17.3% |
| Slovenes | 0.3 /100 | #264 | Tragic 17.3% |
| Poles | 0.3 /100 | #265 | Tragic 17.3% |
| Jamaicans | 0.3 /100 | #266 | Tragic 17.3% |
| Haitians | 0.3 /100 | #267 | Tragic 17.3% |
| Immigrants | Caribbean | 0.3 /100 | #268 | Tragic 17.4% |
| Slavs | 0.3 /100 | #269 | Tragic 17.4% |
| Indonesians | 0.2 /100 | #270 | Tragic 17.4% |
| French American Indians | 0.2 /100 | #271 | Tragic 17.4% |
| Barbadians | 0.1 /100 | #272 | Tragic 17.5% |
| Italians | 0.1 /100 | #273 | Tragic 17.5% |
| Macedonians | 0.1 /100 | #274 | Tragic 17.7% |
| British West Indians | 0.0 /100 | #275 | Tragic 17.7% |
| German Russians | 0.0 /100 | #276 | Tragic 17.7% |