Celtic vs Slavic Single Father Poverty
COMPARE
Celtic
Slavic
Single Father Poverty
Single Father Poverty Comparison
Celtics
Slavs
18.5%
SINGLE FATHER POVERTY
0.0/ 100
METRIC RATING
303rd/ 347
METRIC RANK
17.4%
SINGLE FATHER POVERTY
0.3/ 100
METRIC RATING
269th/ 347
METRIC RANK
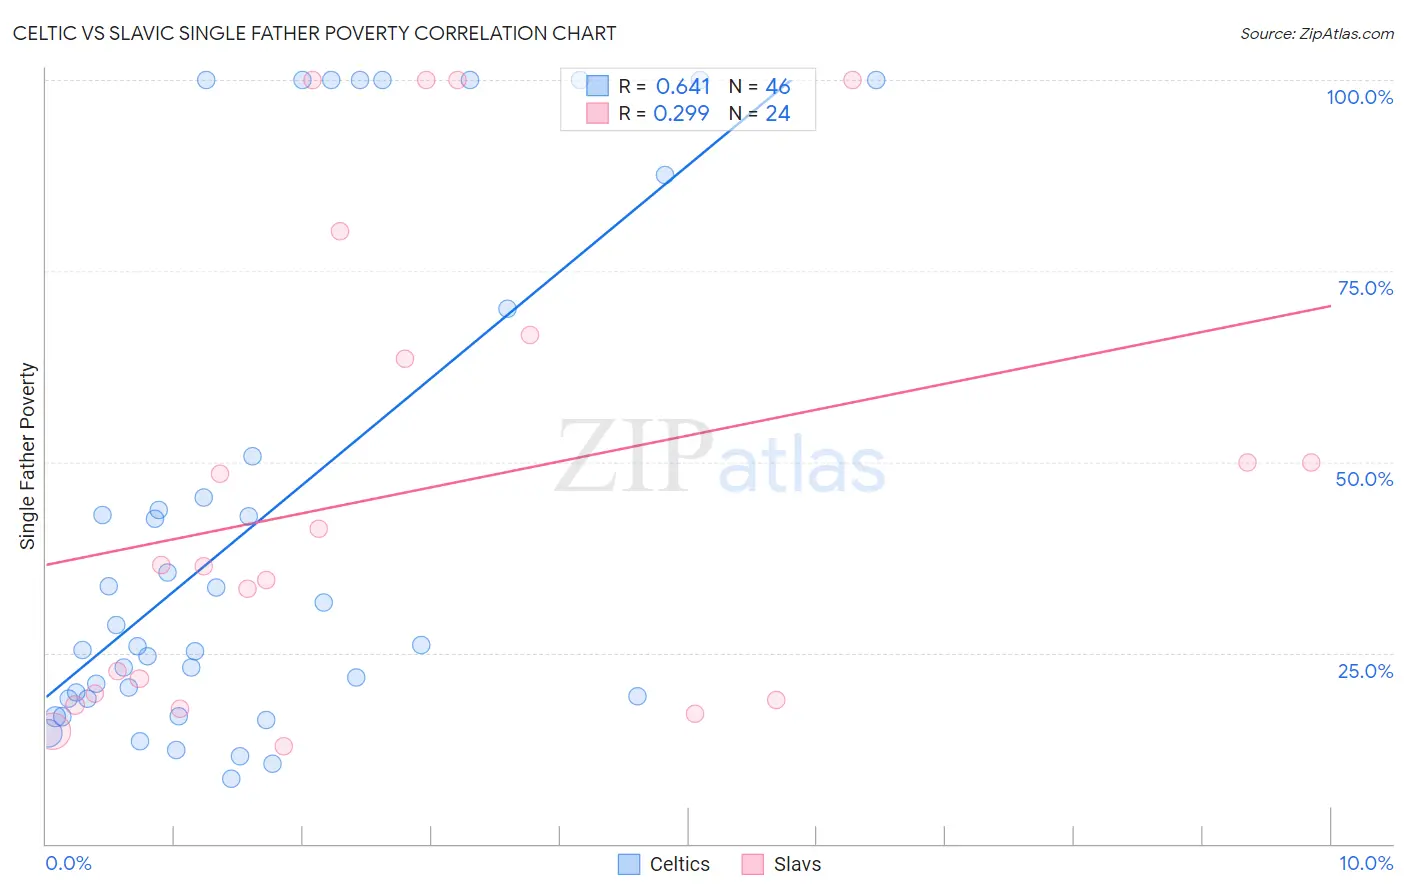
Celtic vs Slavic Single Father Poverty Correlation Chart
The statistical analysis conducted on geographies consisting of 145,202,349 people shows a significant positive correlation between the proportion of Celtics and poverty level among single fathers in the United States with a correlation coefficient (R) of 0.641 and weighted average of 18.5%. Similarly, the statistical analysis conducted on geographies consisting of 218,860,364 people shows a weak positive correlation between the proportion of Slavs and poverty level among single fathers in the United States with a correlation coefficient (R) of 0.299 and weighted average of 17.4%, a difference of 6.4%.
Single Father Poverty Correlation Summary
| Measurement | Celtic | Slavic |
| Minimum | 8.4% | 12.8% |
| Maximum | 100.0% | 100.0% |
| Range | 91.6% | 87.2% |
| Mean | 42.2% | 46.0% |
| Median | 26.0% | 36.4% |
| Interquartile 25% (IQ1) | 19.0% | 19.2% |
| Interquartile 75% (IQ3) | 50.8% | 65.1% |
| Interquartile Range (IQR) | 31.8% | 45.9% |
| Standard Deviation (Sample) | 32.4% | 30.4% |
| Standard Deviation (Population) | 32.1% | 29.7% |
Similar Demographics by Single Father Poverty
Demographics Similar to Celtics by Single Father Poverty
In terms of single father poverty, the demographic groups most similar to Celtics are Comanche (18.5%, a difference of 0.040%), Ute (18.5%, a difference of 0.14%), Hungarian (18.5%, a difference of 0.15%), Blackfeet (18.5%, a difference of 0.19%), and Immigrants from Dominican Republic (18.4%, a difference of 0.37%).
| Demographics | Rating | Rank | Single Father Poverty |
| Seminole | 0.0 /100 | #296 | Tragic 18.1% |
| French | 0.0 /100 | #297 | Tragic 18.2% |
| Africans | 0.0 /100 | #298 | Tragic 18.3% |
| Whites/Caucasians | 0.0 /100 | #299 | Tragic 18.4% |
| Immigrants | Dominican Republic | 0.0 /100 | #300 | Tragic 18.4% |
| Hungarians | 0.0 /100 | #301 | Tragic 18.5% |
| Comanche | 0.0 /100 | #302 | Tragic 18.5% |
| Celtics | 0.0 /100 | #303 | Tragic 18.5% |
| Ute | 0.0 /100 | #304 | Tragic 18.5% |
| Blackfeet | 0.0 /100 | #305 | Tragic 18.5% |
| Scotch-Irish | 0.0 /100 | #306 | Tragic 18.6% |
| French Canadians | 0.0 /100 | #307 | Tragic 18.6% |
| Ottawa | 0.0 /100 | #308 | Tragic 18.6% |
| Immigrants | Micronesia | 0.0 /100 | #309 | Tragic 18.6% |
| Chippewa | 0.0 /100 | #310 | Tragic 18.8% |
Demographics Similar to Slavs by Single Father Poverty
In terms of single father poverty, the demographic groups most similar to Slavs are Immigrants from Caribbean (17.4%, a difference of 0.070%), Haitian (17.3%, a difference of 0.17%), Jamaican (17.3%, a difference of 0.21%), Polish (17.3%, a difference of 0.26%), and Indonesian (17.4%, a difference of 0.26%).
| Demographics | Rating | Rank | Single Father Poverty |
| Immigrants | Zaire | 0.4 /100 | #262 | Tragic 17.3% |
| Lithuanians | 0.4 /100 | #263 | Tragic 17.3% |
| Slovenes | 0.3 /100 | #264 | Tragic 17.3% |
| Poles | 0.3 /100 | #265 | Tragic 17.3% |
| Jamaicans | 0.3 /100 | #266 | Tragic 17.3% |
| Haitians | 0.3 /100 | #267 | Tragic 17.3% |
| Immigrants | Caribbean | 0.3 /100 | #268 | Tragic 17.4% |
| Slavs | 0.3 /100 | #269 | Tragic 17.4% |
| Indonesians | 0.2 /100 | #270 | Tragic 17.4% |
| French American Indians | 0.2 /100 | #271 | Tragic 17.4% |
| Barbadians | 0.1 /100 | #272 | Tragic 17.5% |
| Italians | 0.1 /100 | #273 | Tragic 17.5% |
| Macedonians | 0.1 /100 | #274 | Tragic 17.7% |
| British West Indians | 0.0 /100 | #275 | Tragic 17.7% |
| German Russians | 0.0 /100 | #276 | Tragic 17.7% |