Taiwanese vs Immigrants from Africa Median Earnings
COMPARE
Taiwanese
Immigrants from Africa
Median Earnings
Median Earnings Comparison
Taiwanese
Immigrants from Africa
$47,902
MEDIAN EARNINGS
88.7/ 100
METRIC RATING
140th/ 347
METRIC RANK
$46,564
MEDIAN EARNINGS
54.6/ 100
METRIC RATING
168th/ 347
METRIC RANK
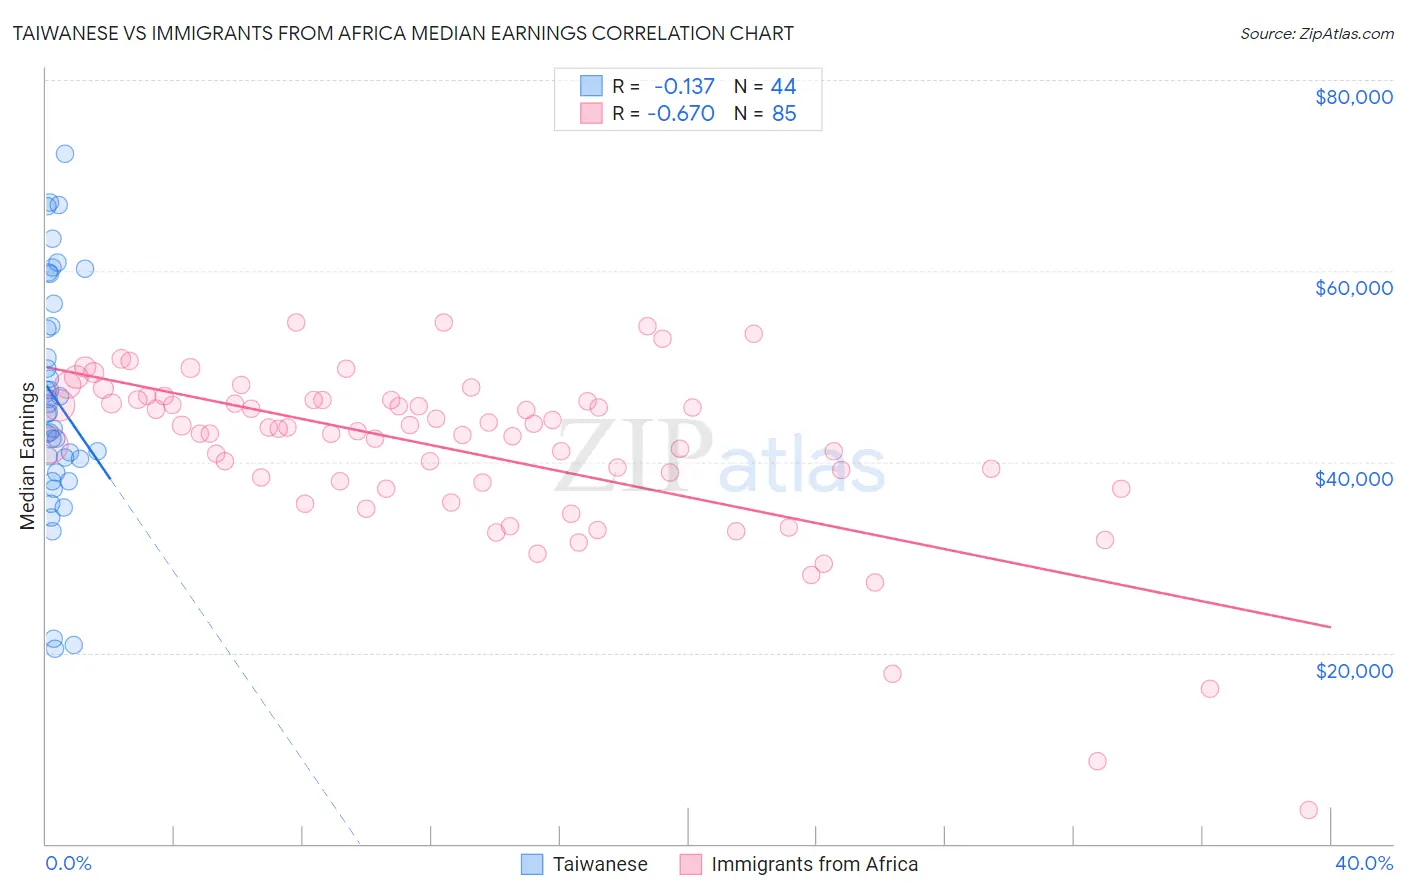
Taiwanese vs Immigrants from Africa Median Earnings Correlation Chart
The statistical analysis conducted on geographies consisting of 31,724,936 people shows a poor negative correlation between the proportion of Taiwanese and median earnings in the United States with a correlation coefficient (R) of -0.137 and weighted average of $47,902. Similarly, the statistical analysis conducted on geographies consisting of 469,401,841 people shows a significant negative correlation between the proportion of Immigrants from Africa and median earnings in the United States with a correlation coefficient (R) of -0.670 and weighted average of $46,564, a difference of 2.9%.
Median Earnings Correlation Summary
| Measurement | Taiwanese | Immigrants from Africa |
| Minimum | $20,462 | $3,500 |
| Maximum | $72,258 | $54,639 |
| Range | $51,796 | $51,139 |
| Mean | $46,503 | $41,149 |
| Median | $45,096 | $43,417 |
| Interquartile 25% (IQ1) | $39,605 | $37,567 |
| Interquartile 75% (IQ3) | $55,414 | $46,460 |
| Interquartile Range (IQR) | $15,809 | $8,893 |
| Standard Deviation (Sample) | $12,277 | $9,174 |
| Standard Deviation (Population) | $12,137 | $9,120 |
Similar Demographics by Median Earnings
Demographics Similar to Taiwanese by Median Earnings
In terms of median earnings, the demographic groups most similar to Taiwanese are Canadian ($47,911, a difference of 0.020%), European ($47,915, a difference of 0.030%), Immigrants from Nepal ($47,925, a difference of 0.050%), Immigrants from Sierra Leone ($47,875, a difference of 0.060%), and Ugandan ($47,854, a difference of 0.10%).
| Demographics | Rating | Rank | Median Earnings |
| Immigrants | Uganda | 90.5 /100 | #133 | Exceptional $48,041 |
| Sri Lankans | 90.5 /100 | #134 | Exceptional $48,040 |
| Portuguese | 90.4 /100 | #135 | Exceptional $48,032 |
| Slovenes | 90.0 /100 | #136 | Excellent $47,995 |
| Immigrants | Nepal | 89.0 /100 | #137 | Excellent $47,925 |
| Europeans | 88.9 /100 | #138 | Excellent $47,915 |
| Canadians | 88.8 /100 | #139 | Excellent $47,911 |
| Taiwanese | 88.7 /100 | #140 | Excellent $47,902 |
| Immigrants | Sierra Leone | 88.3 /100 | #141 | Excellent $47,875 |
| Ugandans | 88.0 /100 | #142 | Excellent $47,854 |
| Swedes | 88.0 /100 | #143 | Excellent $47,851 |
| Hungarians | 87.1 /100 | #144 | Excellent $47,795 |
| Immigrants | Saudi Arabia | 85.6 /100 | #145 | Excellent $47,704 |
| Immigrants | Chile | 85.5 /100 | #146 | Excellent $47,697 |
| Immigrants | South Eastern Asia | 85.0 /100 | #147 | Excellent $47,671 |
Demographics Similar to Immigrants from Africa by Median Earnings
In terms of median earnings, the demographic groups most similar to Immigrants from Africa are Immigrants from South America ($46,548, a difference of 0.030%), Costa Rican ($46,645, a difference of 0.17%), Immigrants ($46,478, a difference of 0.18%), Czechoslovakian ($46,658, a difference of 0.20%), and Scottish ($46,463, a difference of 0.22%).
| Demographics | Rating | Rank | Median Earnings |
| Immigrants | Eastern Africa | 68.0 /100 | #161 | Good $46,969 |
| South American Indians | 67.4 /100 | #162 | Good $46,952 |
| Icelanders | 66.3 /100 | #163 | Good $46,916 |
| Norwegians | 64.7 /100 | #164 | Good $46,865 |
| South Americans | 62.7 /100 | #165 | Good $46,804 |
| Czechoslovakians | 57.8 /100 | #166 | Average $46,658 |
| Costa Ricans | 57.4 /100 | #167 | Average $46,645 |
| Immigrants | Africa | 54.6 /100 | #168 | Average $46,564 |
| Immigrants | South America | 54.0 /100 | #169 | Average $46,548 |
| Immigrants | Immigrants | 51.6 /100 | #170 | Average $46,478 |
| Scottish | 51.1 /100 | #171 | Average $46,463 |
| Kenyans | 51.0 /100 | #172 | Average $46,462 |
| Ghanaians | 50.3 /100 | #173 | Average $46,440 |
| Scandinavians | 50.0 /100 | #174 | Average $46,433 |
| Basques | 48.8 /100 | #175 | Average $46,399 |