Sudanese vs Liberian Single Male Poverty

COMPARE

Sudanese
Race
Ancestry
AfghanAfricanAlaska NativeAlaskan AthabascanAlbanianAleutAlsatianAmericanApacheArabArapahoArgentineanArmenianAssyrian/Chaldean/SyriacAustralianAustrianBahamianBangladeshiBarbadianBasqueBelgianBelizeanBermudanBhutaneseBlackfeetBolivianBrazilianBritishBritish West IndianBulgarianBurmeseCajunCambodianCanadianCape VerdeanCarpatho RusynCelticCentral AmericanCentral American IndianCherokeeCheyenneChickasawChileanChineseChippewaChoctawColombianColvilleComancheCosta RicanCreeCreekCroatianCrowCubanCypriotCzechCzechoslovakianDanishDelawareDominicanDutchDutch West IndianEastern EuropeanEcuadorianEgyptianEnglishEstonianEthiopianEuropeanFijianFilipinoFinnishFrenchFrench American IndianFrench CanadianGermanGerman RussianGhanaianGreekGuamanian/ChamorroGuatemalanGuyaneseHaitianHmongHonduranHopiHoumaHungarianIcelanderIndian (Asian)IndonesianInupiatIranianIraqiIrishIroquoisIsraeliItalianJamaicanJapaneseJordanianKenyanKiowaKoreanLaotianLatvianLebaneseLithuanianLumbeeLuxembourgerMacedonianMalaysianMalteseMarshalleseMenomineeMexicanMexican American IndianMongolianMoroccanNative HawaiianNavajoNepaleseNew ZealanderNicaraguanNigerianNorthern EuropeanNorwegianOkinawanOsageOttawaPaiutePakistaniPalestinianPanamanianParaguayanPennsylvania GermanPeruvianPimaPolishPortuguesePotawatomiPuebloPuerto RicanPuget Sound SalishRomanianRussianSalvadoranSamoanScandinavianScotch-IrishScottishSeminoleSenegaleseSerbianShoshoneSierra LeoneanSiouxSlavicSlovakSloveneSomaliSouth AfricanSouth AmericanSouth American IndianSoviet UnionSpaniardSpanishSpanish AmericanSpanish American IndianSri LankanSubsaharan AfricanSudaneseSwedishSwissSyrianTaiwaneseThaiTlingit-HaidaTohono O'OdhamTonganTrinidadian and TobagonianTsimshianTurkishU.S. Virgin IslanderUgandanUkrainianUruguayanUteVenezuelanVietnameseWelshWest IndianYakamaYaquiYugoslavianYumanYup'ikZimbabwean
Immigration
NonimmigrantsImmigrantsAfghanistanAfricaAlbaniaArgentinaArmeniaAsiaAustraliaAustriaBahamasBangladeshBarbadosBelarusBelgiumBelizeBoliviaBosnia and HerzegovinaBrazilBulgariaBurma/MyanmarCabo VerdeCambodiaCameroonCanadaCaribbeanCentral AmericaChileChinaColombiaCongoCosta RicaCroatiaCubaCzechoslovakiaDenmarkDominicaDominican RepublicEastern AfricaEastern AsiaEastern EuropeEcuadorEgyptEl SalvadorEnglandEritreaEthiopiaEuropeFijiFranceGermanyGhanaGreeceGrenadaGuatemalaGuyanaHaitiHondurasHong KongHungaryIndiaIndonesiaIranIraqIrelandIsraelItalyJamaicaJapanJordanKazakhstanKenyaKoreaKuwaitLaosLatin AmericaLatviaLebanonLiberiaLithuaniaMalaysiaMexicoMicronesiaMiddle AfricaMoldovaMoroccoNepalNetherlandsNicaraguaNigeriaNorth AmericaNorth MacedoniaNorthern AfricaNorthern EuropeNorwayOceaniaPakistanPanamaPeruPhilippinesPolandPortugalRomaniaRussiaSaudi ArabiaScotlandSenegalSerbiaSierra LeoneSingaporeSomaliaSouth AfricaSouth AmericaSouth Central AsiaSouth Eastern AsiaSouthern EuropeSpainSri LankaSt. Vincent and the GrenadinesSudanSwedenSwitzerlandSyriaTaiwanThailandTrinidad and TobagoTurkeyUgandaUkraineUruguayUzbekistanVenezuelaVietnamWest IndiesWestern AfricaWestern AsiaWestern EuropeYemenZaireZimbabweAzores
Liberian
Race
Ancestry
AfghanAfricanAlaska NativeAlaskan AthabascanAlbanianAleutAlsatianAmericanApacheArabArapahoArgentineanArmenianAssyrian/Chaldean/SyriacAustralianAustrianBahamianBangladeshiBarbadianBasqueBelgianBelizeanBermudanBhutaneseBlackfeetBolivianBrazilianBritishBritish West IndianBulgarianBurmeseCajunCambodianCanadianCape VerdeanCarpatho RusynCelticCentral AmericanCentral American IndianCherokeeCheyenneChickasawChileanChineseChippewaChoctawColombianColvilleComancheCosta RicanCreeCreekCroatianCrowCubanCypriotCzechCzechoslovakianDanishDelawareDominicanDutchDutch West IndianEastern EuropeanEcuadorianEgyptianEnglishEstonianEthiopianEuropeanFijianFilipinoFinnishFrenchFrench American IndianFrench CanadianGermanGerman RussianGhanaianGreekGuamanian/ChamorroGuatemalanGuyaneseHaitianHmongHonduranHopiHoumaHungarianIcelanderIndian (Asian)IndonesianInupiatIranianIraqiIrishIroquoisIsraeliItalianJamaicanJapaneseJordanianKenyanKiowaKoreanLaotianLatvianLebaneseLiberianLithuanianLumbeeLuxembourgerMacedonianMalaysianMalteseMarshalleseMenomineeMexicanMexican American IndianMongolianMoroccanNative HawaiianNavajoNepaleseNew ZealanderNicaraguanNigerianNorthern EuropeanNorwegianOkinawanOsageOttawaPaiutePakistaniPalestinianPanamanianParaguayanPennsylvania GermanPeruvianPimaPolishPortuguesePotawatomiPuebloPuerto RicanPuget Sound SalishRomanianRussianSalvadoranSamoanScandinavianScotch-IrishScottishSeminoleSenegaleseSerbianShoshoneSierra LeoneanSiouxSlavicSlovakSloveneSomaliSouth AfricanSouth AmericanSouth American IndianSoviet UnionSpaniardSpanishSpanish AmericanSpanish American IndianSri LankanSubsaharan AfricanSwedishSwissSyrianTaiwaneseThaiTlingit-HaidaTohono O'OdhamTonganTrinidadian and TobagonianTsimshianTurkishU.S. Virgin IslanderUgandanUkrainianUruguayanUteVenezuelanVietnameseWelshWest IndianYakamaYaquiYugoslavianYumanYup'ikZimbabwean
Immigration
NonimmigrantsImmigrantsAfghanistanAfricaAlbaniaArgentinaArmeniaAsiaAustraliaAustriaBahamasBangladeshBarbadosBelarusBelgiumBelizeBoliviaBosnia and HerzegovinaBrazilBulgariaBurma/MyanmarCabo VerdeCambodiaCameroonCanadaCaribbeanCentral AmericaChileChinaColombiaCongoCosta RicaCroatiaCubaCzechoslovakiaDenmarkDominicaDominican RepublicEastern AfricaEastern AsiaEastern EuropeEcuadorEgyptEl SalvadorEnglandEritreaEthiopiaEuropeFijiFranceGermanyGhanaGreeceGrenadaGuatemalaGuyanaHaitiHondurasHong KongHungaryIndiaIndonesiaIranIraqIrelandIsraelItalyJamaicaJapanJordanKazakhstanKenyaKoreaKuwaitLaosLatin AmericaLatviaLebanonLiberiaLithuaniaMalaysiaMexicoMicronesiaMiddle AfricaMoldovaMoroccoNepalNetherlandsNicaraguaNigeriaNorth AmericaNorth MacedoniaNorthern AfricaNorthern EuropeNorwayOceaniaPakistanPanamaPeruPhilippinesPolandPortugalRomaniaRussiaSaudi ArabiaScotlandSenegalSerbiaSierra LeoneSingaporeSomaliaSouth AfricaSouth AmericaSouth Central AsiaSouth Eastern AsiaSouthern EuropeSpainSri LankaSt. Vincent and the GrenadinesSudanSwedenSwitzerlandSyriaTaiwanThailandTrinidad and TobagoTurkeyUgandaUkraineUruguayUzbekistanVenezuelaVietnamWest IndiesWestern AfricaWestern AsiaWestern EuropeYemenZaireZimbabweAzores
Single Male Poverty
Income
Poverty
Unemployment
Labor Participation
Family Structure
Vehicle Availability
Education Level
Disability

Single Male Poverty Comparison

Sudanese

Liberians

Poor
Fair
13.1%
SINGLE MALE POVERTY
17.7/ 100
METRIC RATING
207th/ 347
METRIC RANK
13.0%
SINGLE MALE POVERTY
25.2/ 100
METRIC RATING
194th/ 347
METRIC RANK

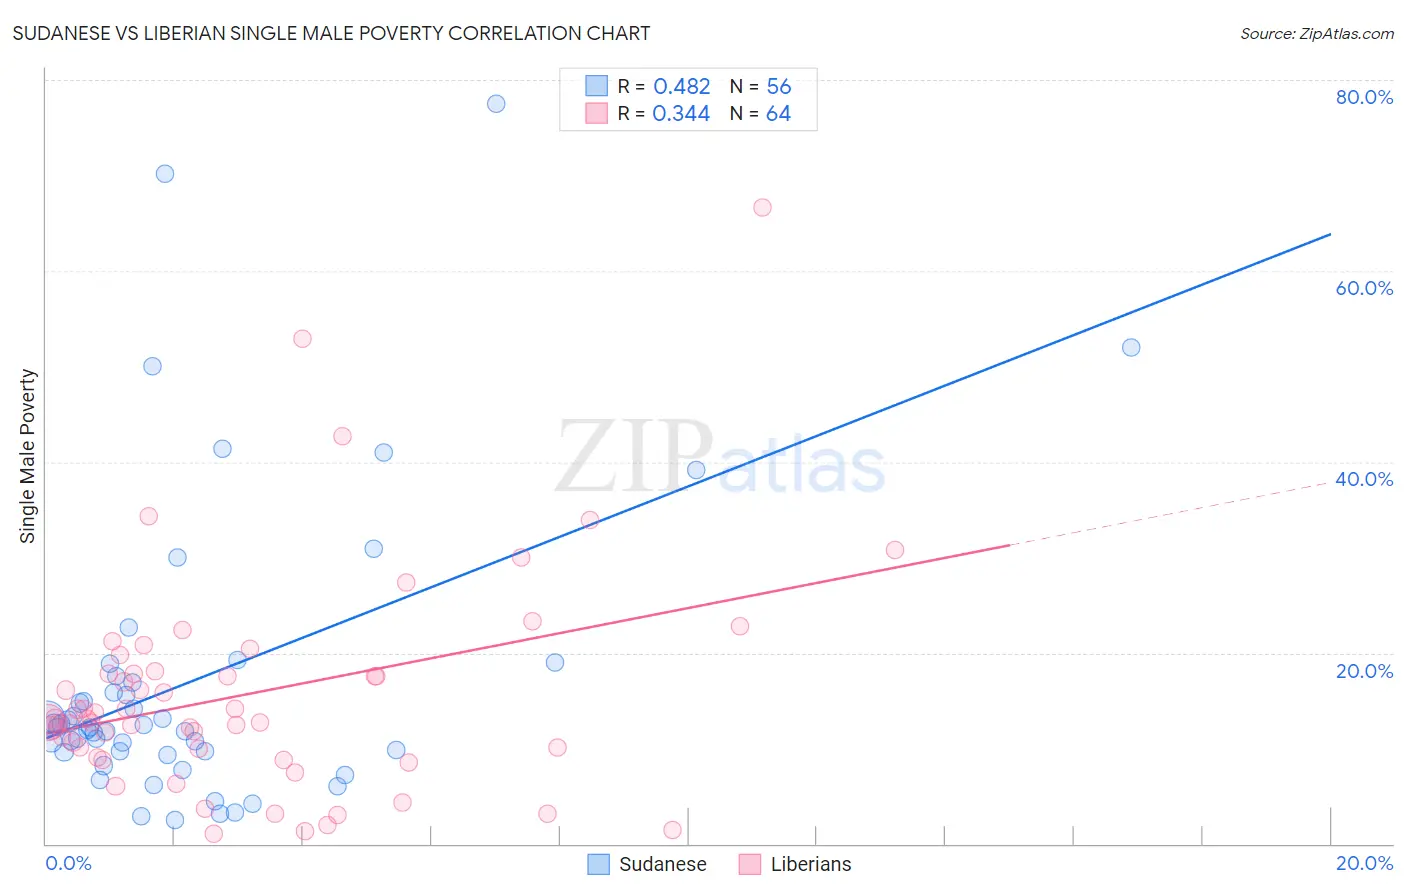
Sudanese vs Liberian Single Male Poverty Correlation Chart

The statistical analysis conducted on geographies consisting of 106,028,362 people shows a moderate positive correlation between the proportion of Sudanese and poverty level among single males in the United States with a correlation coefficient (R) of 0.482 and weighted average of 13.1%. Similarly, the statistical analysis conducted on geographies consisting of 112,749,237 people shows a mild positive correlation between the proportion of Liberians and poverty level among single males in the United States with a correlation coefficient (R) of 0.344 and weighted average of 13.0%, a difference of 0.58%.
Sudanese vs Liberian Single Male Poverty

Single Male Poverty Correlation Summary

MeasurementSudaneseLiberian
Minimum2.5%1.0%
Maximum77.6%66.7%
Range75.0%65.7%
Mean17.1%15.7%
Median12.2%12.9%
Interquartile 25% (IQ1)9.6%9.5%
Interquartile 75% (IQ3)17.2%17.9%
Interquartile Range (IQR)7.5%8.4%
Standard Deviation (Sample)15.6%11.6%
Standard Deviation (Population)15.5%11.5%

Demographics Similar to Sudanese and Liberians by Single Male Poverty

In terms of single male poverty, the demographic groups most similar to Sudanese are Immigrants from Western Africa (13.1%, a difference of 0.010%), Mexican American Indian (13.1%, a difference of 0.020%), Immigrants from Haiti (13.1%, a difference of 0.080%), Northern European (13.0%, a difference of 0.10%), and Polish (13.0%, a difference of 0.14%). Similarly, the demographic groups most similar to Liberians are Immigrants from South Africa (13.0%, a difference of 0.070%), Immigrants from Thailand (13.0%, a difference of 0.090%), Immigrants from Jamaica (13.0%, a difference of 0.090%), Arab (13.0%, a difference of 0.12%), and Immigrants from England (13.0%, a difference of 0.13%).
DemographicsRating | RankSingle Male Poverty
Arabs
27.0
/100
|
#190
Fair
13.0%
Immigrants | Thailand
26.6
/100
|
#191
Fair
13.0%
Immigrants | Jamaica
26.5
/100
|
#192
Fair
13.0%
Immigrants | South Africa
26.1
/100
|
#193
Fair
13.0%
Liberians
25.2
/100
|
#194
Fair
13.0%
Immigrants | England
23.4
/100
|
#195
Fair
13.0%
Immigrants | Grenada
23.1
/100
|
#196
Fair
13.0%
Immigrants | Laos
23.1
/100
|
#197
Fair
13.0%
Lithuanians
22.1
/100
|
#198
Fair
13.0%
Immigrants | Norway
21.8
/100
|
#199
Fair
13.0%
Slovenes
21.6
/100
|
#200
Fair
13.0%
Trinidadians and Tobagonians
21.4
/100
|
#201
Fair
13.0%
Basques
20.7
/100
|
#202
Fair
13.0%
Immigrants | Bangladesh
20.4
/100
|
#203
Fair
13.0%
Estonians
20.3
/100
|
#204
Fair
13.0%
Poles
19.3
/100
|
#205
Poor
13.0%
Northern Europeans
18.9
/100
|
#206
Poor
13.0%
Sudanese
17.7
/100
|
#207
Poor
13.1%
Immigrants | Western Africa
17.6
/100
|
#208
Poor
13.1%
Mexican American Indians
17.5
/100
|
#209
Poor
13.1%
Immigrants | Haiti
16.8
/100
|
#210
Poor
13.1%