Brazilian vs Immigrants from Morocco Married-Couple Family Poverty
COMPARE
Brazilian
Immigrants from Morocco
Married-Couple Family Poverty
Married-Couple Family Poverty Comparison
Brazilians
Immigrants from Morocco
5.0%
MARRIED-COUPLE FAMILY POVERTY
78.3/ 100
METRIC RATING
150th/ 347
METRIC RANK
5.4%
MARRIED-COUPLE FAMILY POVERTY
24.3/ 100
METRIC RATING
200th/ 347
METRIC RANK
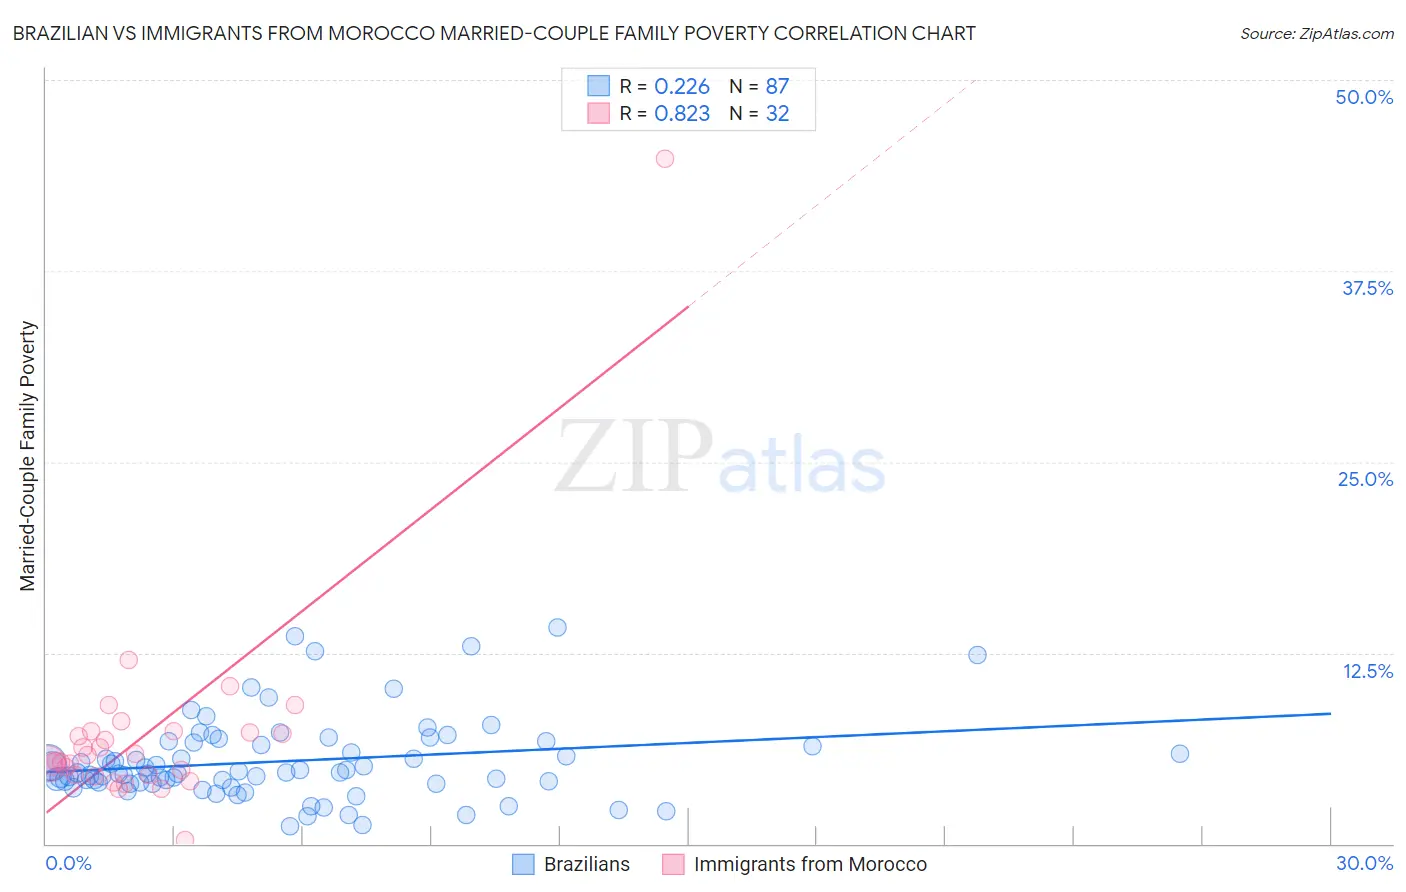
Brazilian vs Immigrants from Morocco Married-Couple Family Poverty Correlation Chart
The statistical analysis conducted on geographies consisting of 321,555,687 people shows a weak positive correlation between the proportion of Brazilians and poverty level among married-couple families in the United States with a correlation coefficient (R) of 0.226 and weighted average of 5.0%. Similarly, the statistical analysis conducted on geographies consisting of 178,420,133 people shows a very strong positive correlation between the proportion of Immigrants from Morocco and poverty level among married-couple families in the United States with a correlation coefficient (R) of 0.823 and weighted average of 5.4%, a difference of 7.3%.
Married-Couple Family Poverty Correlation Summary
| Measurement | Brazilian | Immigrants from Morocco |
| Minimum | 1.1% | 0.27% |
| Maximum | 14.2% | 44.8% |
| Range | 13.0% | 44.6% |
| Mean | 5.4% | 7.2% |
| Median | 4.6% | 5.6% |
| Interquartile 25% (IQ1) | 4.0% | 4.5% |
| Interquartile 75% (IQ3) | 6.6% | 7.3% |
| Interquartile Range (IQR) | 2.6% | 2.8% |
| Standard Deviation (Sample) | 2.7% | 7.2% |
| Standard Deviation (Population) | 2.7% | 7.1% |
Similar Demographics by Married-Couple Family Poverty
Demographics Similar to Brazilians by Married-Couple Family Poverty
In terms of married-couple family poverty, the demographic groups most similar to Brazilians are Immigrants from Oceania (5.0%, a difference of 0.050%), Syrian (5.0%, a difference of 0.080%), Immigrants from Russia (5.0%, a difference of 0.080%), Immigrants from Cameroon (5.0%, a difference of 0.17%), and Albanian (5.0%, a difference of 0.19%).
| Demographics | Rating | Rank | Married-Couple Family Poverty |
| Immigrants | Egypt | 83.4 /100 | #143 | Excellent 5.0% |
| Hmong | 83.2 /100 | #144 | Excellent 5.0% |
| Immigrants | Spain | 79.9 /100 | #145 | Good 5.0% |
| Mongolians | 79.8 /100 | #146 | Good 5.0% |
| Syrians | 78.7 /100 | #147 | Good 5.0% |
| Immigrants | Russia | 78.7 /100 | #148 | Good 5.0% |
| Immigrants | Oceania | 78.6 /100 | #149 | Good 5.0% |
| Brazilians | 78.3 /100 | #150 | Good 5.0% |
| Immigrants | Cameroon | 77.3 /100 | #151 | Good 5.0% |
| Albanians | 77.2 /100 | #152 | Good 5.0% |
| Immigrants | Kuwait | 76.3 /100 | #153 | Good 5.0% |
| Delaware | 73.7 /100 | #154 | Good 5.1% |
| Immigrants | Ethiopia | 72.4 /100 | #155 | Good 5.1% |
| Sri Lankans | 72.2 /100 | #156 | Good 5.1% |
| Argentineans | 70.7 /100 | #157 | Good 5.1% |
Demographics Similar to Immigrants from Morocco by Married-Couple Family Poverty
In terms of married-couple family poverty, the demographic groups most similar to Immigrants from Morocco are Lebanese (5.4%, a difference of 0.020%), Immigrants from Middle Africa (5.4%, a difference of 0.080%), Uruguayan (5.4%, a difference of 0.11%), Immigrants from Belarus (5.4%, a difference of 0.29%), and Liberian (5.4%, a difference of 0.31%).
| Demographics | Rating | Rank | Married-Couple Family Poverty |
| Malaysians | 29.5 /100 | #193 | Fair 5.4% |
| Immigrants | Israel | 27.8 /100 | #194 | Fair 5.4% |
| Immigrants | Azores | 27.5 /100 | #195 | Fair 5.4% |
| Spaniards | 27.4 /100 | #196 | Fair 5.4% |
| Liberians | 26.3 /100 | #197 | Fair 5.4% |
| Immigrants | Belarus | 26.2 /100 | #198 | Fair 5.4% |
| Uruguayans | 25.0 /100 | #199 | Fair 5.4% |
| Immigrants | Morocco | 24.3 /100 | #200 | Fair 5.4% |
| Lebanese | 24.1 /100 | #201 | Fair 5.4% |
| Immigrants | Middle Africa | 23.8 /100 | #202 | Fair 5.4% |
| Immigrants | Peru | 21.8 /100 | #203 | Fair 5.4% |
| Immigrants | Costa Rica | 19.4 /100 | #204 | Poor 5.4% |
| Chippewa | 18.9 /100 | #205 | Poor 5.4% |
| Osage | 18.4 /100 | #206 | Poor 5.4% |
| Immigrants | Africa | 17.6 /100 | #207 | Poor 5.5% |