Spanish American vs Dominican Married-Couple Family Poverty
COMPARE
Spanish American
Dominican
Married-Couple Family Poverty
Married-Couple Family Poverty Comparison
Spanish Americans
Dominicans
6.2%
MARRIED-COUPLE FAMILY POVERTY
0.2/ 100
METRIC RATING
267th/ 347
METRIC RANK
8.3%
MARRIED-COUPLE FAMILY POVERTY
0.0/ 100
METRIC RATING
332nd/ 347
METRIC RANK
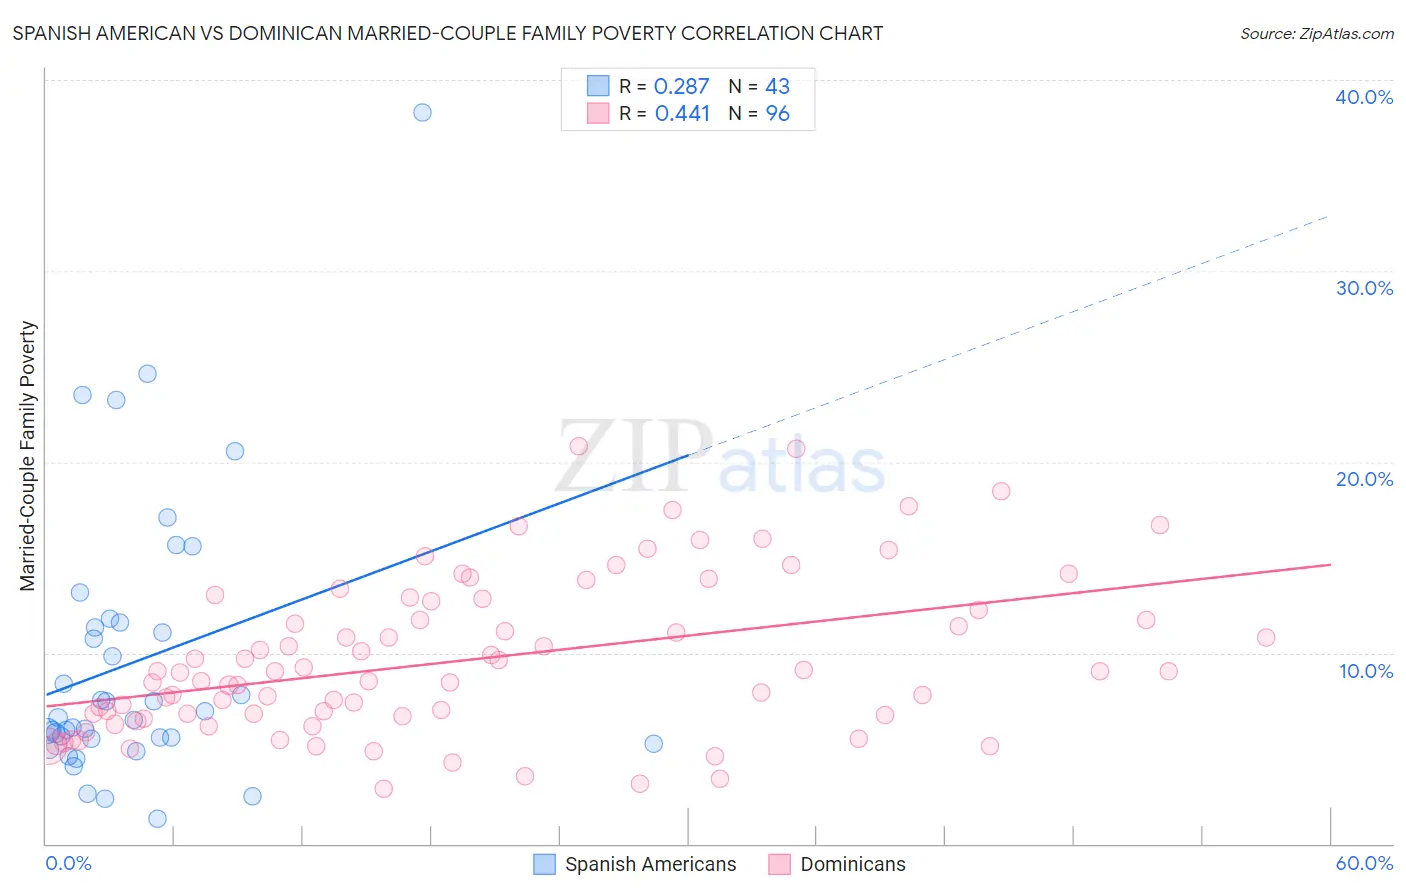
Spanish American vs Dominican Married-Couple Family Poverty Correlation Chart
The statistical analysis conducted on geographies consisting of 103,037,673 people shows a weak positive correlation between the proportion of Spanish Americans and poverty level among married-couple families in the United States with a correlation coefficient (R) of 0.287 and weighted average of 6.2%. Similarly, the statistical analysis conducted on geographies consisting of 351,701,155 people shows a moderate positive correlation between the proportion of Dominicans and poverty level among married-couple families in the United States with a correlation coefficient (R) of 0.441 and weighted average of 8.3%, a difference of 34.5%.
Married-Couple Family Poverty Correlation Summary
| Measurement | Spanish American | Dominican |
| Minimum | 1.3% | 2.9% |
| Maximum | 38.3% | 20.8% |
| Range | 37.0% | 17.9% |
| Mean | 9.6% | 9.6% |
| Median | 6.6% | 9.0% |
| Interquartile 25% (IQ1) | 5.5% | 6.7% |
| Interquartile 75% (IQ3) | 11.6% | 12.5% |
| Interquartile Range (IQR) | 6.0% | 5.7% |
| Standard Deviation (Sample) | 7.3% | 4.1% |
| Standard Deviation (Population) | 7.3% | 4.1% |
Similar Demographics by Married-Couple Family Poverty
Demographics Similar to Spanish Americans by Married-Couple Family Poverty
In terms of married-couple family poverty, the demographic groups most similar to Spanish Americans are Creek (6.2%, a difference of 0.050%), Blackfeet (6.2%, a difference of 0.13%), Alaska Native (6.2%, a difference of 0.48%), Immigrants from Congo (6.1%, a difference of 0.56%), and Immigrants from West Indies (6.2%, a difference of 0.65%).
| Demographics | Rating | Rank | Married-Couple Family Poverty |
| Jamaicans | 0.3 /100 | #260 | Tragic 6.1% |
| Senegalese | 0.3 /100 | #261 | Tragic 6.1% |
| Shoshone | 0.3 /100 | #262 | Tragic 6.1% |
| Immigrants | Senegal | 0.3 /100 | #263 | Tragic 6.1% |
| Immigrants | Congo | 0.2 /100 | #264 | Tragic 6.1% |
| Blackfeet | 0.2 /100 | #265 | Tragic 6.2% |
| Creek | 0.2 /100 | #266 | Tragic 6.2% |
| Spanish Americans | 0.2 /100 | #267 | Tragic 6.2% |
| Alaska Natives | 0.2 /100 | #268 | Tragic 6.2% |
| Immigrants | West Indies | 0.1 /100 | #269 | Tragic 6.2% |
| Immigrants | Jamaica | 0.1 /100 | #270 | Tragic 6.2% |
| Immigrants | Bahamas | 0.1 /100 | #271 | Tragic 6.2% |
| Trinidadians and Tobagonians | 0.1 /100 | #272 | Tragic 6.2% |
| Colville | 0.1 /100 | #273 | Tragic 6.3% |
| Barbadians | 0.1 /100 | #274 | Tragic 6.3% |
Demographics Similar to Dominicans by Married-Couple Family Poverty
In terms of married-couple family poverty, the demographic groups most similar to Dominicans are Central American Indian (8.3%, a difference of 0.060%), Paiute (8.3%, a difference of 0.12%), Lumbee (8.3%, a difference of 0.47%), Immigrants from Dominican Republic (8.4%, a difference of 1.1%), and Native/Alaskan (8.2%, a difference of 1.4%).
| Demographics | Rating | Rank | Married-Couple Family Poverty |
| Immigrants | Cuba | 0.0 /100 | #325 | Tragic 7.5% |
| Immigrants | Bangladesh | 0.0 /100 | #326 | Tragic 7.5% |
| Hispanics or Latinos | 0.0 /100 | #327 | Tragic 7.5% |
| Immigrants | Mexico | 0.0 /100 | #328 | Tragic 7.6% |
| Natives/Alaskans | 0.0 /100 | #329 | Tragic 8.2% |
| Paiute | 0.0 /100 | #330 | Tragic 8.3% |
| Central American Indians | 0.0 /100 | #331 | Tragic 8.3% |
| Dominicans | 0.0 /100 | #332 | Tragic 8.3% |
| Lumbee | 0.0 /100 | #333 | Tragic 8.3% |
| Immigrants | Dominican Republic | 0.0 /100 | #334 | Tragic 8.4% |
| Sioux | 0.0 /100 | #335 | Tragic 8.7% |
| Apache | 0.0 /100 | #336 | Tragic 9.0% |
| Yakama | 0.0 /100 | #337 | Tragic 9.0% |
| Cheyenne | 0.0 /100 | #338 | Tragic 9.4% |
| Crow | 0.0 /100 | #339 | Tragic 9.6% |