Immigrants from Ecuador vs Creek Male Poverty
COMPARE
Immigrants from Ecuador
Creek
Male Poverty
Male Poverty Comparison
Immigrants from Ecuador
Creek
12.9%
MALE POVERTY
0.2/ 100
METRIC RATING
252nd/ 347
METRIC RANK
14.1%
MALE POVERTY
0.0/ 100
METRIC RATING
306th/ 347
METRIC RANK
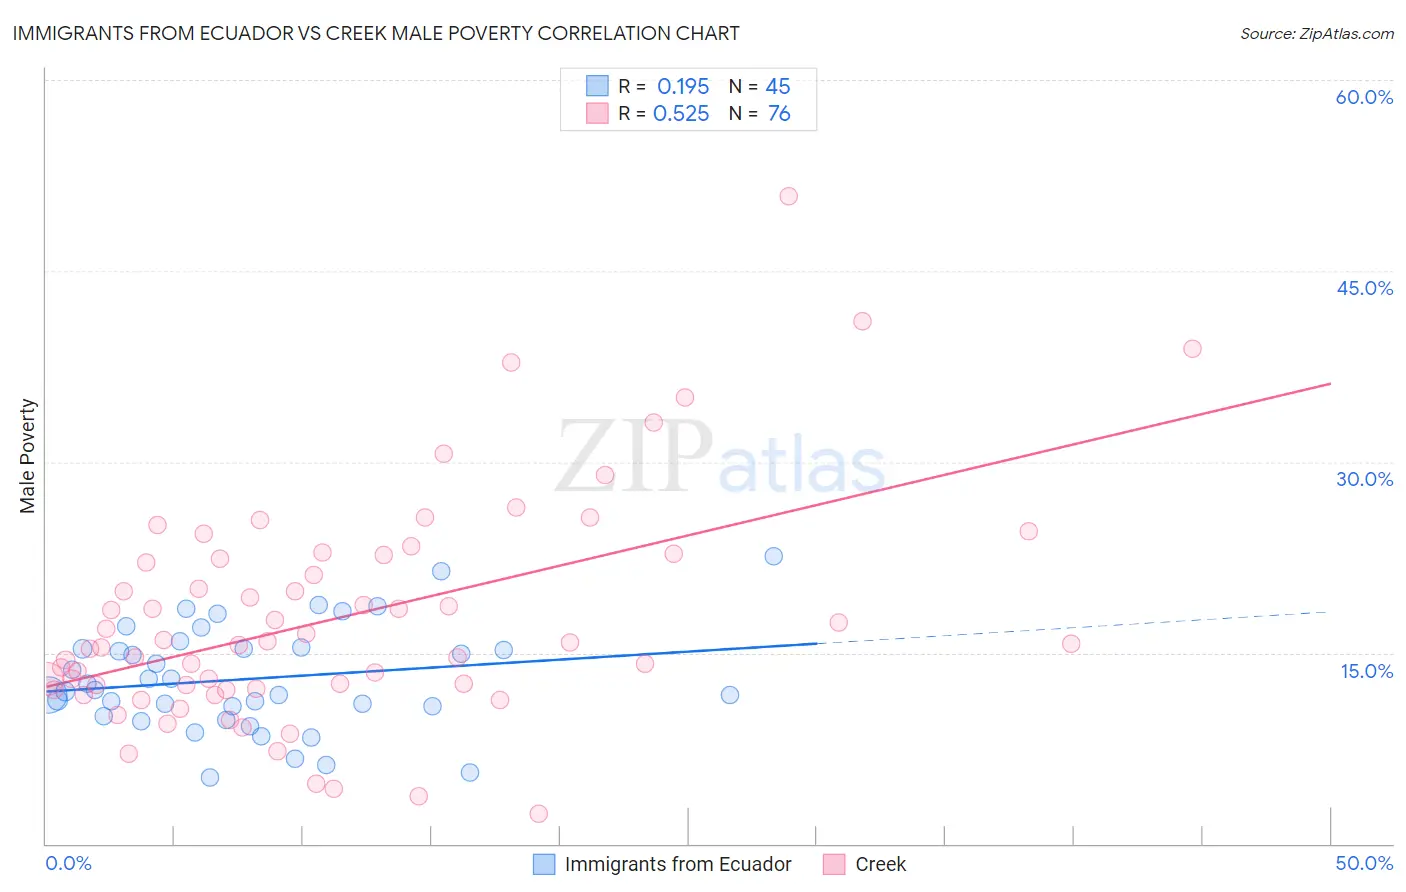
Immigrants from Ecuador vs Creek Male Poverty Correlation Chart
The statistical analysis conducted on geographies consisting of 270,825,114 people shows a poor positive correlation between the proportion of Immigrants from Ecuador and poverty level among males in the United States with a correlation coefficient (R) of 0.195 and weighted average of 12.9%. Similarly, the statistical analysis conducted on geographies consisting of 178,404,623 people shows a substantial positive correlation between the proportion of Creek and poverty level among males in the United States with a correlation coefficient (R) of 0.525 and weighted average of 14.1%, a difference of 9.2%.
Male Poverty Correlation Summary
| Measurement | Immigrants from Ecuador | Creek |
| Minimum | 5.2% | 2.3% |
| Maximum | 22.6% | 50.8% |
| Range | 17.4% | 48.5% |
| Mean | 13.0% | 17.8% |
| Median | 12.1% | 15.7% |
| Interquartile 25% (IQ1) | 10.4% | 12.3% |
| Interquartile 75% (IQ3) | 15.4% | 22.5% |
| Interquartile Range (IQR) | 4.9% | 10.2% |
| Standard Deviation (Sample) | 4.1% | 8.9% |
| Standard Deviation (Population) | 4.0% | 8.8% |
Similar Demographics by Male Poverty
Demographics Similar to Immigrants from Ecuador by Male Poverty
In terms of male poverty, the demographic groups most similar to Immigrants from Ecuador are Immigrants from Cuba (12.9%, a difference of 0.030%), Immigrants from Ghana (12.9%, a difference of 0.050%), Immigrants from Nicaragua (12.9%, a difference of 0.13%), Potawatomi (12.9%, a difference of 0.14%), and Immigrants from Sudan (12.9%, a difference of 0.21%).
| Demographics | Rating | Rank | Male Poverty |
| Liberians | 0.3 /100 | #245 | Tragic 12.8% |
| Immigrants | El Salvador | 0.2 /100 | #246 | Tragic 12.8% |
| Immigrants | Western Africa | 0.2 /100 | #247 | Tragic 12.9% |
| Immigrants | Sudan | 0.2 /100 | #248 | Tragic 12.9% |
| Potawatomi | 0.2 /100 | #249 | Tragic 12.9% |
| Immigrants | Nicaragua | 0.2 /100 | #250 | Tragic 12.9% |
| Immigrants | Cuba | 0.2 /100 | #251 | Tragic 12.9% |
| Immigrants | Ecuador | 0.2 /100 | #252 | Tragic 12.9% |
| Immigrants | Ghana | 0.2 /100 | #253 | Tragic 12.9% |
| Mexican American Indians | 0.1 /100 | #254 | Tragic 13.0% |
| Immigrants | Liberia | 0.1 /100 | #255 | Tragic 13.0% |
| Immigrants | Burma/Myanmar | 0.1 /100 | #256 | Tragic 13.0% |
| Immigrants | Trinidad and Tobago | 0.1 /100 | #257 | Tragic 13.1% |
| Cape Verdeans | 0.1 /100 | #258 | Tragic 13.1% |
| Cherokee | 0.1 /100 | #259 | Tragic 13.1% |
Demographics Similar to Creek by Male Poverty
In terms of male poverty, the demographic groups most similar to Creek are Immigrants from Bangladesh (14.1%, a difference of 0.070%), Senegalese (14.1%, a difference of 0.29%), Bahamian (14.1%, a difference of 0.39%), Immigrants from Caribbean (14.0%, a difference of 0.43%), and Immigrants from Senegal (14.0%, a difference of 0.49%).
| Demographics | Rating | Rank | Male Poverty |
| Immigrants | Guatemala | 0.0 /100 | #299 | Tragic 14.0% |
| Immigrants | Mexico | 0.0 /100 | #300 | Tragic 14.0% |
| Immigrants | Senegal | 0.0 /100 | #301 | Tragic 14.0% |
| Immigrants | Caribbean | 0.0 /100 | #302 | Tragic 14.0% |
| Bahamians | 0.0 /100 | #303 | Tragic 14.1% |
| Senegalese | 0.0 /100 | #304 | Tragic 14.1% |
| Immigrants | Bangladesh | 0.0 /100 | #305 | Tragic 14.1% |
| Creek | 0.0 /100 | #306 | Tragic 14.1% |
| Dutch West Indians | 0.0 /100 | #307 | Tragic 14.2% |
| Africans | 0.0 /100 | #308 | Tragic 14.2% |
| Somalis | 0.0 /100 | #309 | Tragic 14.3% |
| Seminole | 0.0 /100 | #310 | Tragic 14.3% |
| Hondurans | 0.0 /100 | #311 | Tragic 14.3% |
| Choctaw | 0.0 /100 | #312 | Tragic 14.4% |
| Immigrants | Somalia | 0.0 /100 | #313 | Tragic 14.6% |